While many traders are taking a break this weekend, I’ve been on the hunt for momentum stocks to trade.
As I was searching for stocks to keep on my watchlist, I noticed the cryptocurrency market caught a nice pop on Saturday…
And those who missed out may chase the action because they don’t want to miss another leg up.
I think the Robinhood traders won’t necessarily look for trades in cryptocurrencies, after all… not all of them are available to trade.
Instead, I think they’ll look to jump into stocks with exposure to the cryptocurrency market.
I’ve actually uncovered a few that I want to keep on my radar…
Not because Robinhood traders might pile in, but because the chart patterns indicate there may be a large move in the cards.
Could These Blockchain / Cryptocurrency Stocks Pop Off?
With the surge in cryptocurrency prices, this could be the next sector Robinhood traders focus on. There are stocks that actually provide exposure to the space…
Some of them are flashing bullish chart patterns right now.
One that comes to mind is Canaan Inc. (CAN).
It’s a China-based computer-hardware manufacturer that specializes in Blockchain solutions and Bitcoin mining.
Of course, the cryptocurrencies have been moving and that’s a catalyst that could attract traders, but what was more interesting to me was the CAN’s chart.
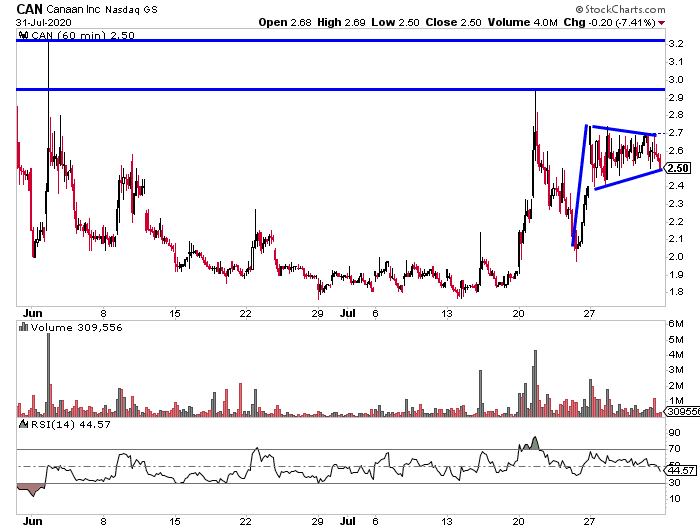
On the hourly chart, CAN formed a bull flag / bull pennant.

This pattern typically indicates the stock can run higher, and there are key levels above… if CAN makes a move, it has room to the $3.20 area, about 28% higher.
That wasn’t the only Bitcoin / Blockchain stock I noticed with this bullish pattern.
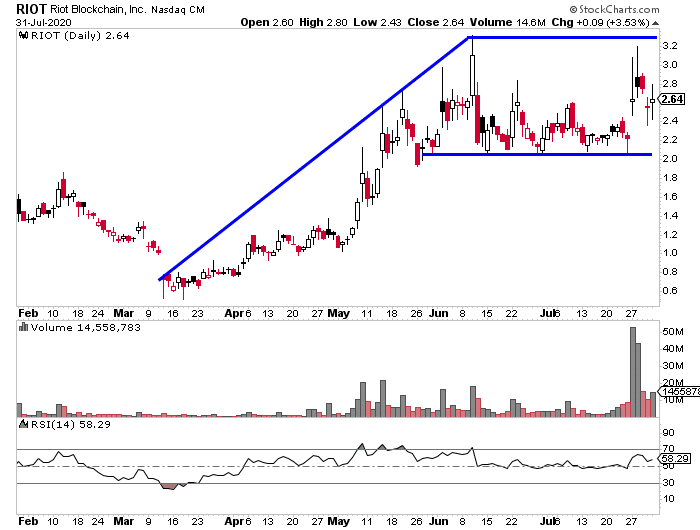
Riot Blockchain (RIOT) is another name to keep on the radar.

It’s got a similar pattern to CAN, and it’s one of my favorite patterns to use, which typically helps to uncover break out opportunities.
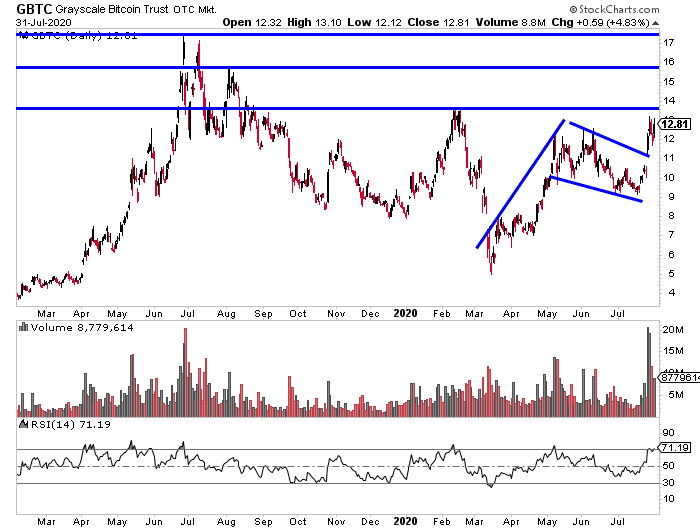
Grayscale Bitcoin Trust (GBTC) is another name that comes to mind. However, take note this stock trades on OTC Markets, and it’s often thought to be riskier than other major exchanges.
On the daily chart, GBTC broke out of its consolidation area, and if it breaks above $13.60, I think this stock could pop to $16.

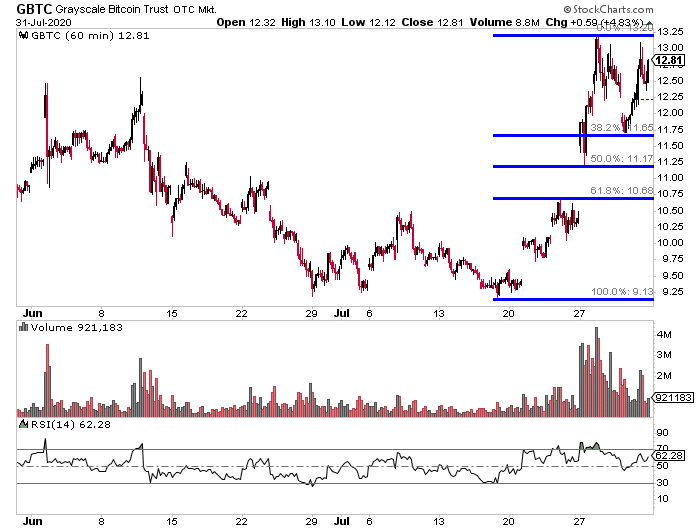
Not only that, but the Fibonacci retracement levels are holding up fairly well in GBTC.

While there are dozens of trading patterns and indicators out there, I’ve only found a small handful to be reliable…
And I just showed you one of those patterns.
I want to show you how to turn these patterns into actionable trade ideas, that’s why I wrote Momentum Hunter.
It won’t cost you a dime for this eBook.
You’ll learn how I uncover momentum stocks poised to move.
WE MAY HOLD SECURITIES DISCUSSED. RagingBull has not been paid directly or indirectly by the issuer of any security mentioned in the Services. However, Ragingbull.com, LLC, its owners, and its employees may purchase, sell, or hold long or short positions in securities of the companies mentioned in this communication.

0 Comments