Chart patterns are no holy grail, but by all means they are one of the most important tools in my trading arsenal.
With so many chart patterns out there, it often gets difficult to figure out which one is best for you.
It requires hard work, analyzing chart patterns, and pairing them with catalysts and other factors to actually build a strategy around a specific setup.
Now, there is one pattern I love to use, especially in this environment, and I want to teach you a little about bull flags and point you to some small-cap momentum stocks on the radar.
What are Bull Flags or Pennants?
Chances are you may be familiar with the name and may even have experience using it.
For those getting started, here are some of the basics:
“Bull” means the overall trend is higher and “Flag” comes from the fact that the chart actually looks like a flag. Keep in mind, the market is risky and there are no guarantees with this pattern.
You see, technical analysis is not an exact science. Just because it worked before, that doesn’t guarantee the pattern will hold.
There are other factors that can cause a pattern to break, and it’s important to understand all the different risk factors in the market. For example, one of those are catalyst events, such as the risk of no stimulus, which may cause a stock to break.
Getting back to the bull flag / pennant pattern.
Check out this recent example in NIO:

Bull Flags typically occur after a stock makes a large up move (the pole) and then consolidates higher, range bound, digesting the gains (the flag).
If the flag’s lower bound holds, it’s indicates two things for me:
- There’s significant demand (support) at current levels
- A break out of a flag higher can typically bring in a new wave of fresh buyers and continue the uptrend.
How to Trade a Bull Flag?
Bull flag is a great pattern to use as it kills 2 birds with one stone:
- Confirms the uptrend: a flagging stock just broke out higher and is holding well at new levels
- Gives a very clean and tight level to trade against while providing significant upside
Of course, it’s not as simple as that, trading does require hard work.
However, for the purpose of this lesson, I want to stick with the pattern. So take a look at one stock that has a bull flag pattern.

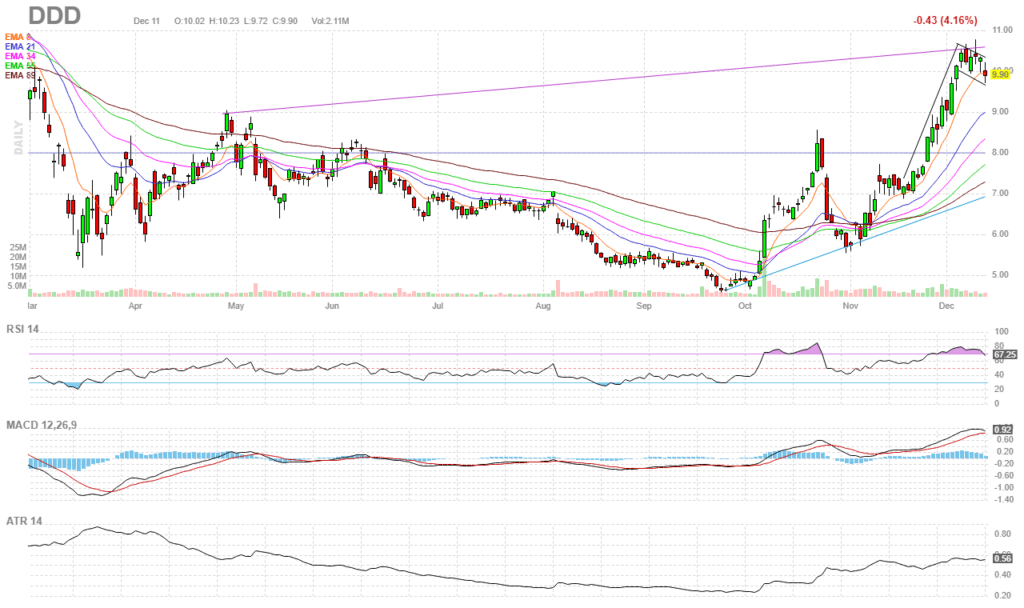
It’s 3D Systems Corporation (DDD), and it’s got a bull flag setup, as shown in the chart above. Some other factors I’m considering here include the float, and the short interest.
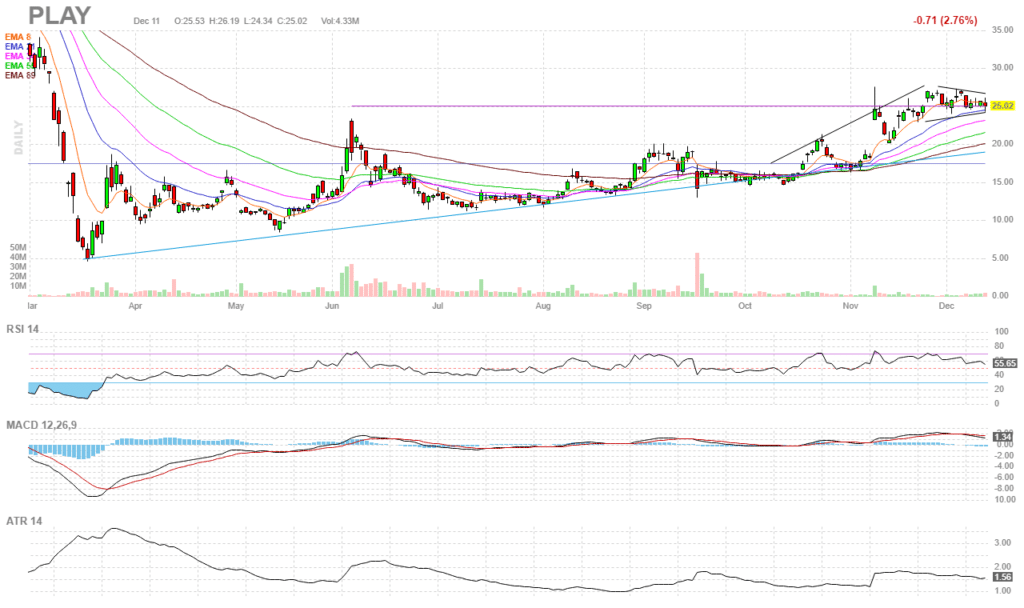
Next up, there’s Dave & Buster’s Entertainment (PLAY).

You have to use a bit of imagination with chart patterns, but if you look at the chart above, I see a bull flag / pennant setup. Given potential vaccine news and a high short interest, this stock has potential to break out, in my opinion.
Of course, we’ll have to wait and see whether this pattern will actually hold.
I’ll be sending out a momentum stocks watchlist tomorrow. So make sure to be on the lookout for it.

Hey Jason,
Dude this was super helpful and to the point. Like a cheat sheet, could you do more of these?
Thanks again for all your help and wisdom!!
Thank you Jason for sharing this knowledge!
I’ll study this after this early eve when I’ll be free! Looks very intriguing. Love to learn! Thx. Best, Lauren F.
Great write up Jason! Can you elaborate on short interest in a future entry?
Thanks ,
JS
hello jason, hows doing? hope so very well it’s really wonderful &helpful also great job i’m so exciting about it.keep it up for me plz if you have no problem that,thanks again and again for all help.
fb
very helpful jb
Super hip. I like the momentum.