When it comes to trading momentum stocks, I think there’s one important concept that many don’t think about.
Those who understand it are in a position to uncover stocks poised to run, in my opinion.
In fact, it’s one of the first things I look for when I scan and filter for momentum stocks to hunt down.
I know what you’re probably wondering, “Jason, what are you actually referring to?”
Liquidity
Of course, the first thing many traders think about when they hear the word liquidity is volume — more specifically, share volume.
However, I believe the more important indicator of liquidity is dollar volume ($ volume).
Why?
Don’t Ignore Dollar Volume If You Trade Momentum Stocks
You’ve probably heard of volume before. When traders refer to volume, they typically refer to the total number of shares traded for a specific period.
Sure, it’s great to use sometimes… but I don’t think it necessarily gives traders a great idea of liquidity and tradeability.
For example, Indoor Harvest Corp (INQD) caught a pop on Thursday as pot stocks caught a bid off news that it can potentially treat and prevent coronavirus. Well, 337,837,555 shares traded yesterday.
It sounds like the stock was liquid, right?
At least, that’s what a beginner momentum trader would think…
But the stock closed at $0.0007… so that means it had under $300K in dollar volume that day.
I don’t know about you, but trading a stock with such low liquidity, in terms of $ volume, could be a disaster…
Think about it like this, if someone wanted to sell $30K worth of INQD, the stock could pull back.
When you look at $ volume liquidity, it’s the share price multiplied by the daily share volume.
Basically, the higher the $ volume… the more liquid a stock is, in my opinion. Typically, the greater the $ volume, the tighter the bid-ask spread, but remember share volume also impacts the $ volume.
By looking at $ volume, it actually lets me filter for potential momentum trading opportunities.
How I Use $ Volume In My Trading
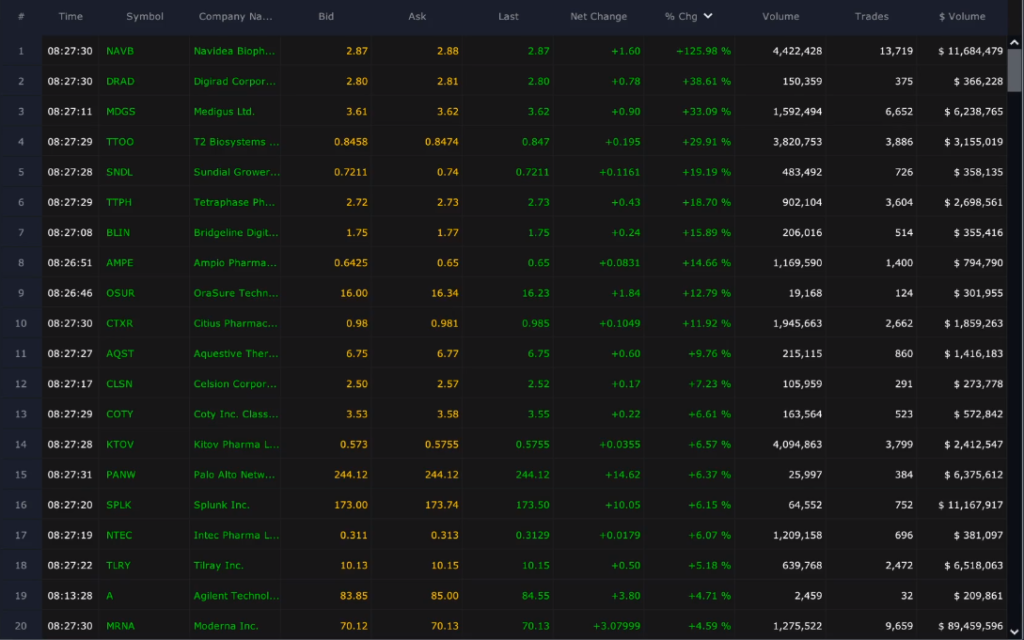
For me personally, $ volume is one of the first things I look at, as mentioned before. Basically, when I’m looking for momentum stocks to trade, I filter for stocks with at least $200K in $ volume in the pre-market.
Thereafter, I sort by % change.

Source: Scanz Technologies
By conducting this scan in the pre-market, I’m able to game plan and find a handful of stocks I may want to trade.
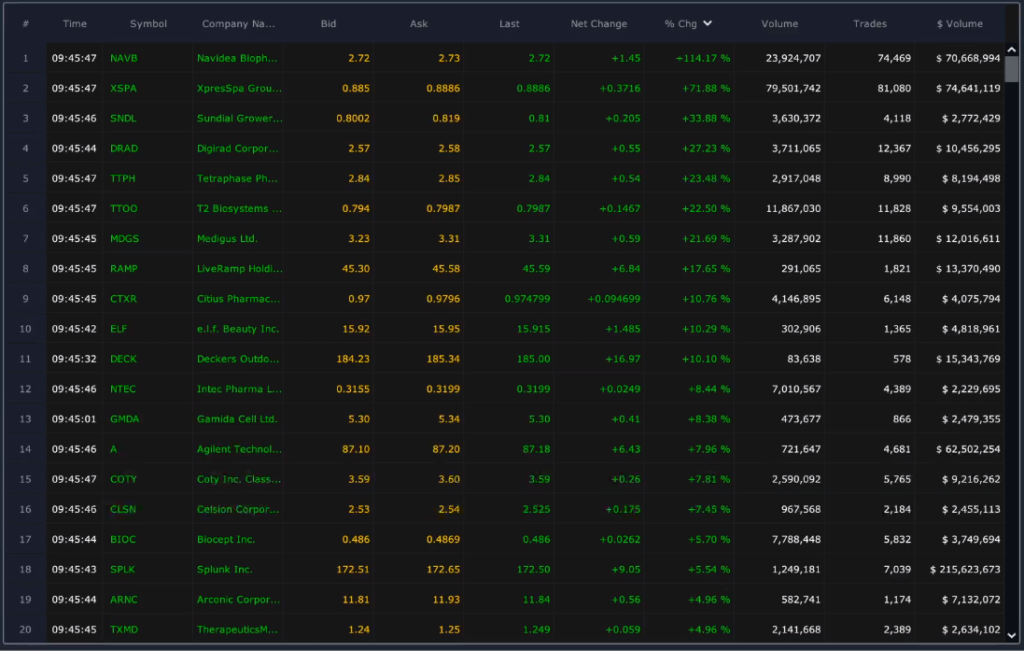
Now, after the opening bell, I actually increase the $ volume filter.
Why?
Well, think about it like this… in the pre-market hours, the $ volume is light and stocks could be gapping up… but if the $ volume doesn’t increase after, I think the chances of them moving higher is slim.
So here’s what I do after the open…

Source: Scanz Technologies
I increase the $ volume to $2M… that way I can know if these momentum stocks have room to continue higher.
Once I’ve filtered down stocks that are moving… I look at the charts to try to identify my bread-and-butter setups.
For example, let’s say I spotted a stock that gapped and was moving fast… if I didn’t catch the initial move, I would look for pullbacks and identify areas of value.
Let me show you what I mean by that.
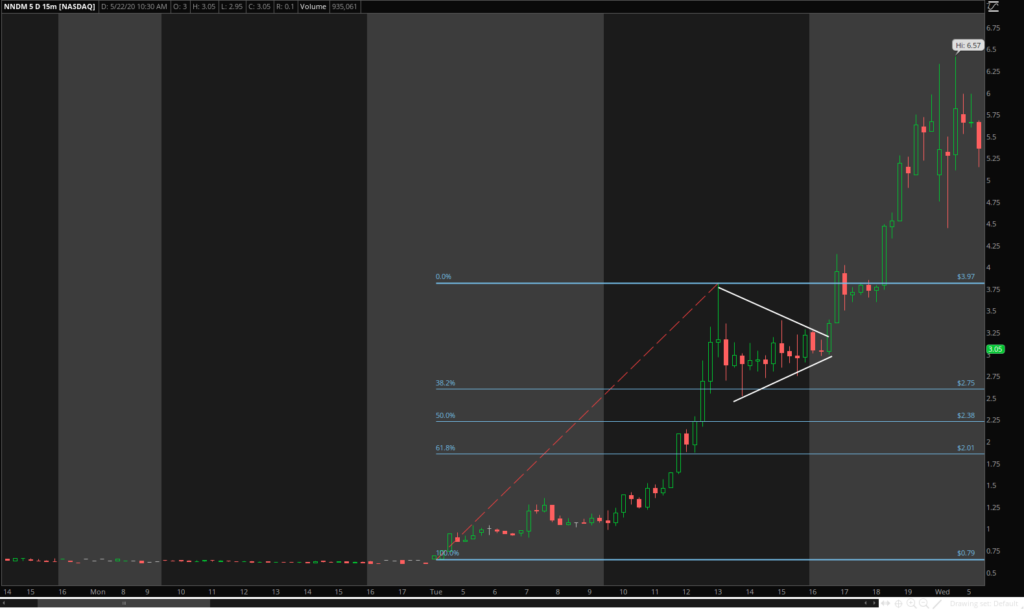
The other day NNDM actually caught a nice pop and showed up on my scanner. I missed the move, but with a news event… I figured it could continue higher, but I just needed to see one of my patterns before I made a move.

Source: thinkorswim
I actually noticed the Fibonacci retracement pattern, as well as a bull flag setup.
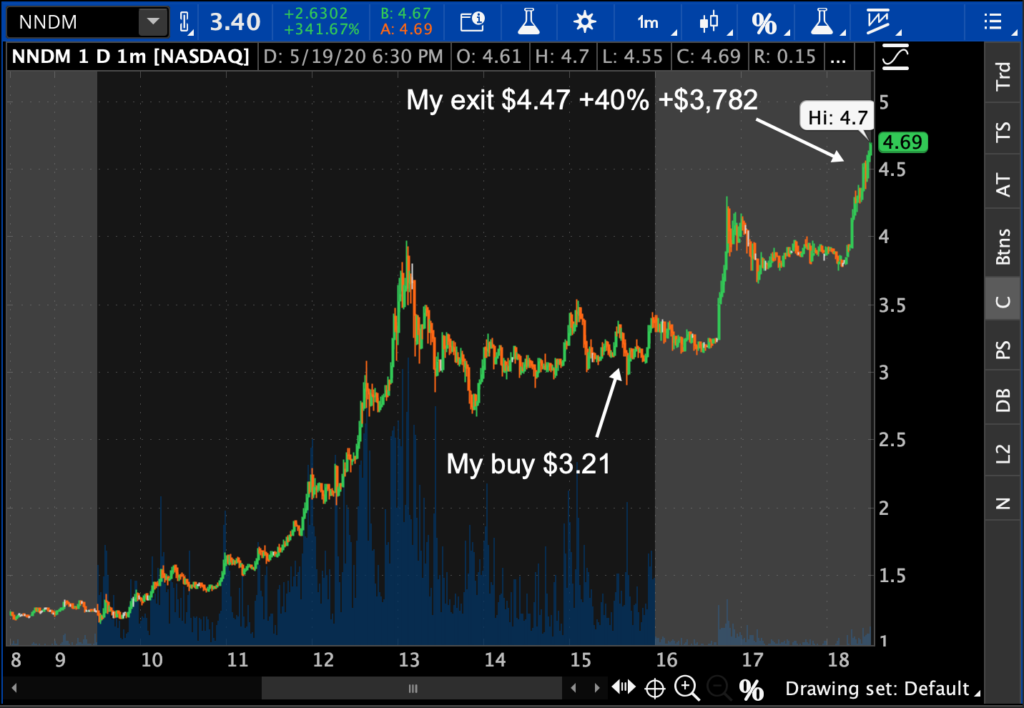
So I actually was able to buy shares in the consolidation area in the afternoon and looked for a gap up in the evening or the following morning.
In the post-market that day, I actually saw NNDM continue higher… and I was able to lock in a 40% in just a matter of hours!

Now, if you want to learn how I hunt down momentum stocks poised to move, then you may want to check out this special training session I put together.
In it, I detail my number 1 edge in the market, and how I’m able to trade on a part-time schedule.

0 Comments