The most important factor that affects stock prices is supply & demand.
If you can uncover key areas in which demand can pick up, I believe you can become a better trader and put yourself in a position to win.
I know what you’re thinking, “How can you possibly figure out where buyers will likely step in?”
For me, it’s simple — just focus on the price action.
You see, there are specific patterns that can signal when a stock can make a move.
I want to reveal to you one of my favorite patterns — and how I utilized it to uncover a ~40% winner in Cassava Sciences Inc (SAVA).
The Pattern That Uncovered A ~40% Winner In SAVA
Here’s what I sent out on Monday morning in my advance notice alert.
And now for a bottle rocket trade idea. Former spiker SAVA has good news this morning and range to $10. It’s up nearly 100% already but I’m watching close to see if this breakout will challenge those levels. Volume is already $27M premarket and it’s the 3rd most active stock behind ORCL and NKLA. I’ll be watching this one all day starting near the open for gap recovery and go. Then again this afternoon for a bull flag or pennant.
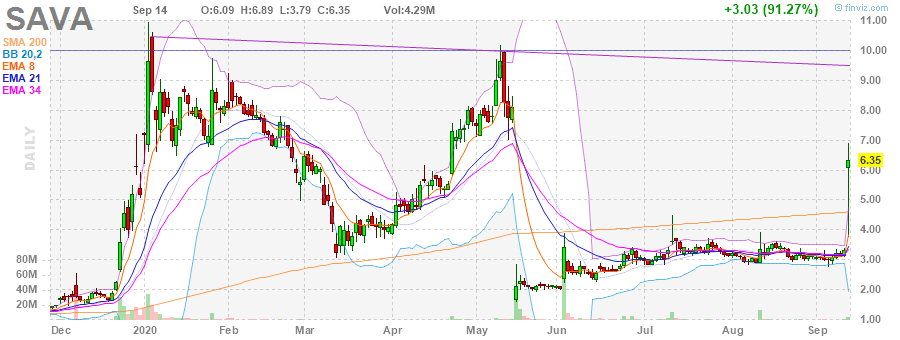
SAVA was already making a move in the pre-market, and typically, with these large movers, there are areas of value if you know where to look.
At 1:01 PM on Monday, here’s was I sent out: bought 5k SAVA 6.14, probable day trade, possible gap play, goal 10-20% today, tonight or tomorrow morning
The reason I bought around that area?
The stock was consolidating near the 38.2% Fibonacci level, a sign there was a chance it could continue and reach the high of day.
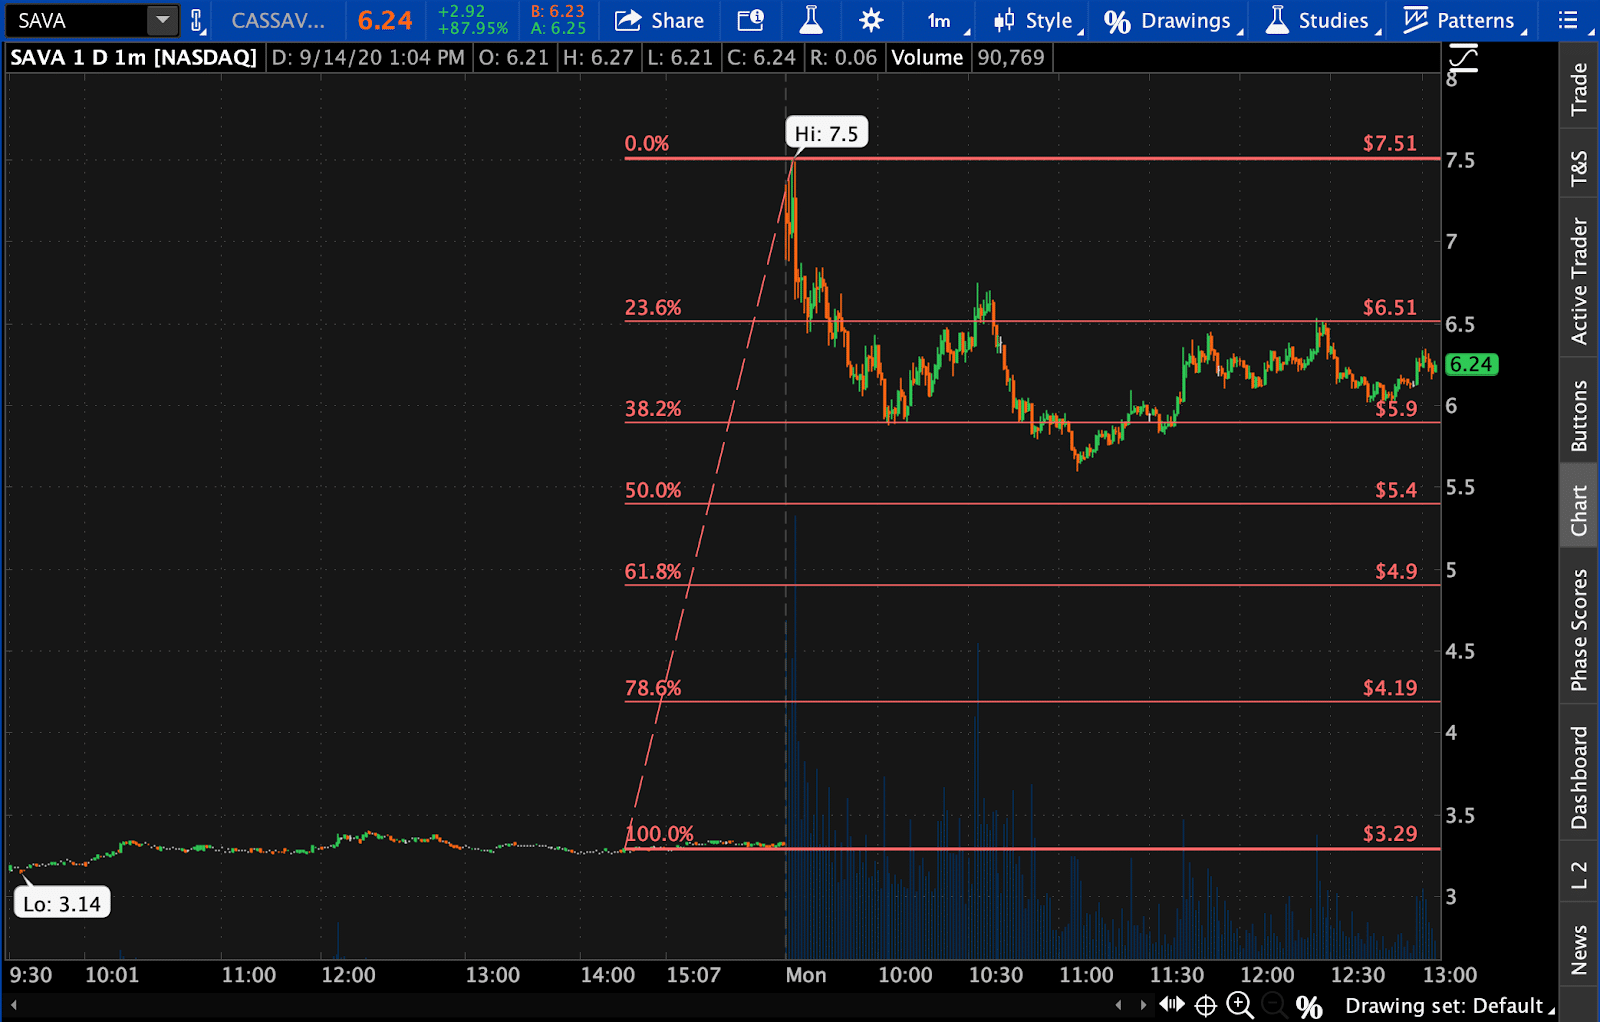
There was demand flowing into the stock…
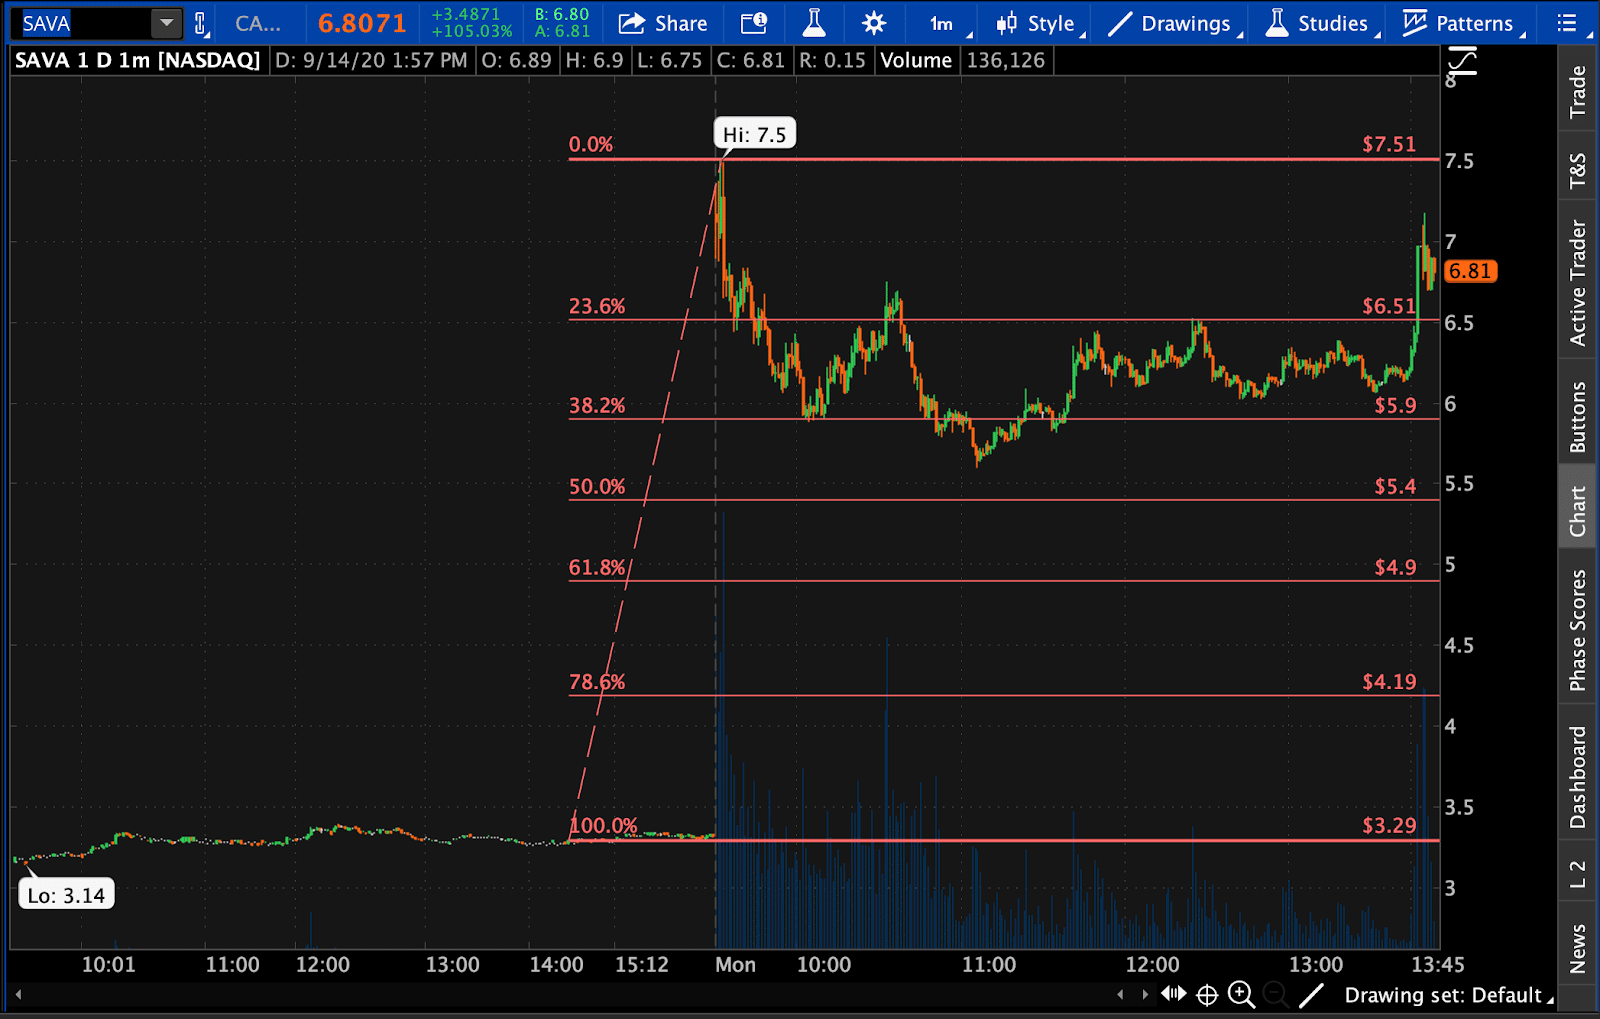
I continued to monitor the stock because I was looking at $7.50+ for a target, which was likely. I also looked to maybe ride some for a gap too given that huge pivot around the area.
At 2:57 PM ET, the stock got right around the target I was looking for, and I sold part of my position.
$7.50 ws the high of day so if that broke above, there was a probable gap, so I wanted to keep 2K shares to see if I can juice a little more out of SAVA.
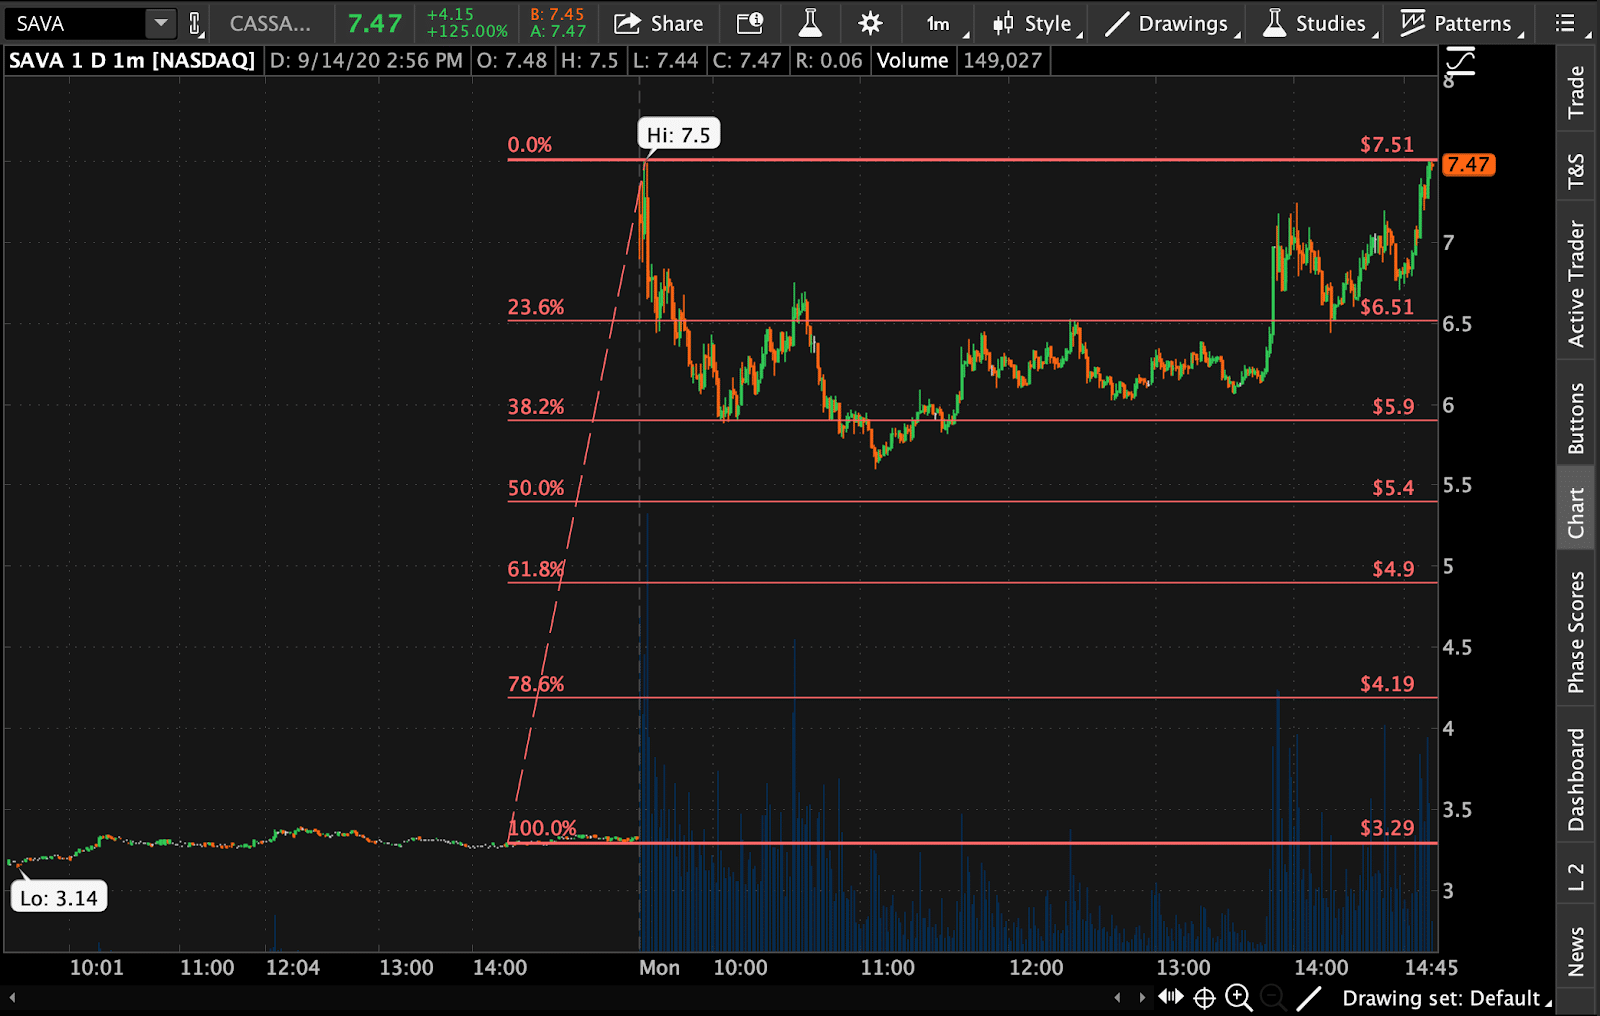
Here’s what I sent at 3:14 PM on Monday (just a little over 2 hours after I entered the trade).
Shares broke out above the $7.50 high, confirming my thesis. With 2,000 shares left my goal is 1/2 off in the $8’s.
If all goes well it’ll consolidate in the upper $7’s now and rally again. I’m up 27% overall here and $7,000 on the day. Love those triple 7’s there on the screen capture – lol – ya – I’m superstitious and see that as a good sign. All kidding aside, the price action is strong so I’m doing my job as a trader trimming and trailing as it demonstrates strength.
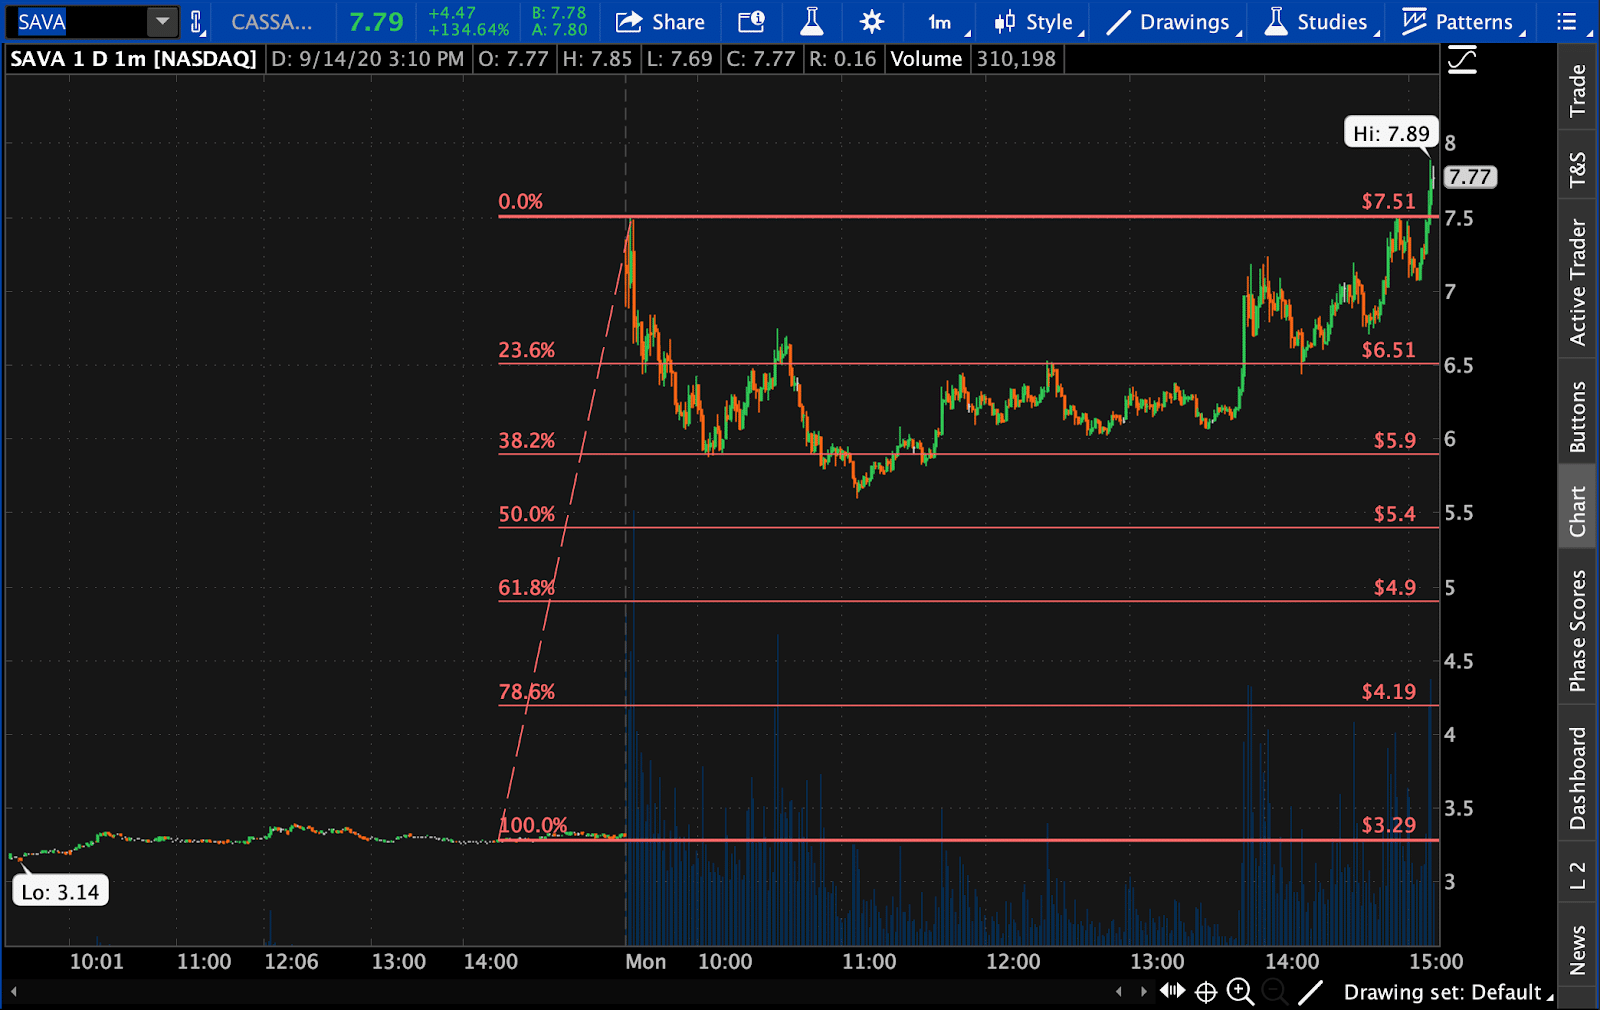
The stock continued higher and got to the $8 area, and I sold 1K shares around there.
Shortly before the closing bell, I actually decided to take the rest off the table.
Really nice trade here. Sure I could hold some for the gap but the alert was at $6.13 and it just hit $8.41, far exceeding my goal. Sold my final 1k shares there at $7.78 after it feel below $8. Total profit $7,500ish. Even though I’m out, it’ll be interesting to see if it comes in or gaps higher, I like to watch that and learn.
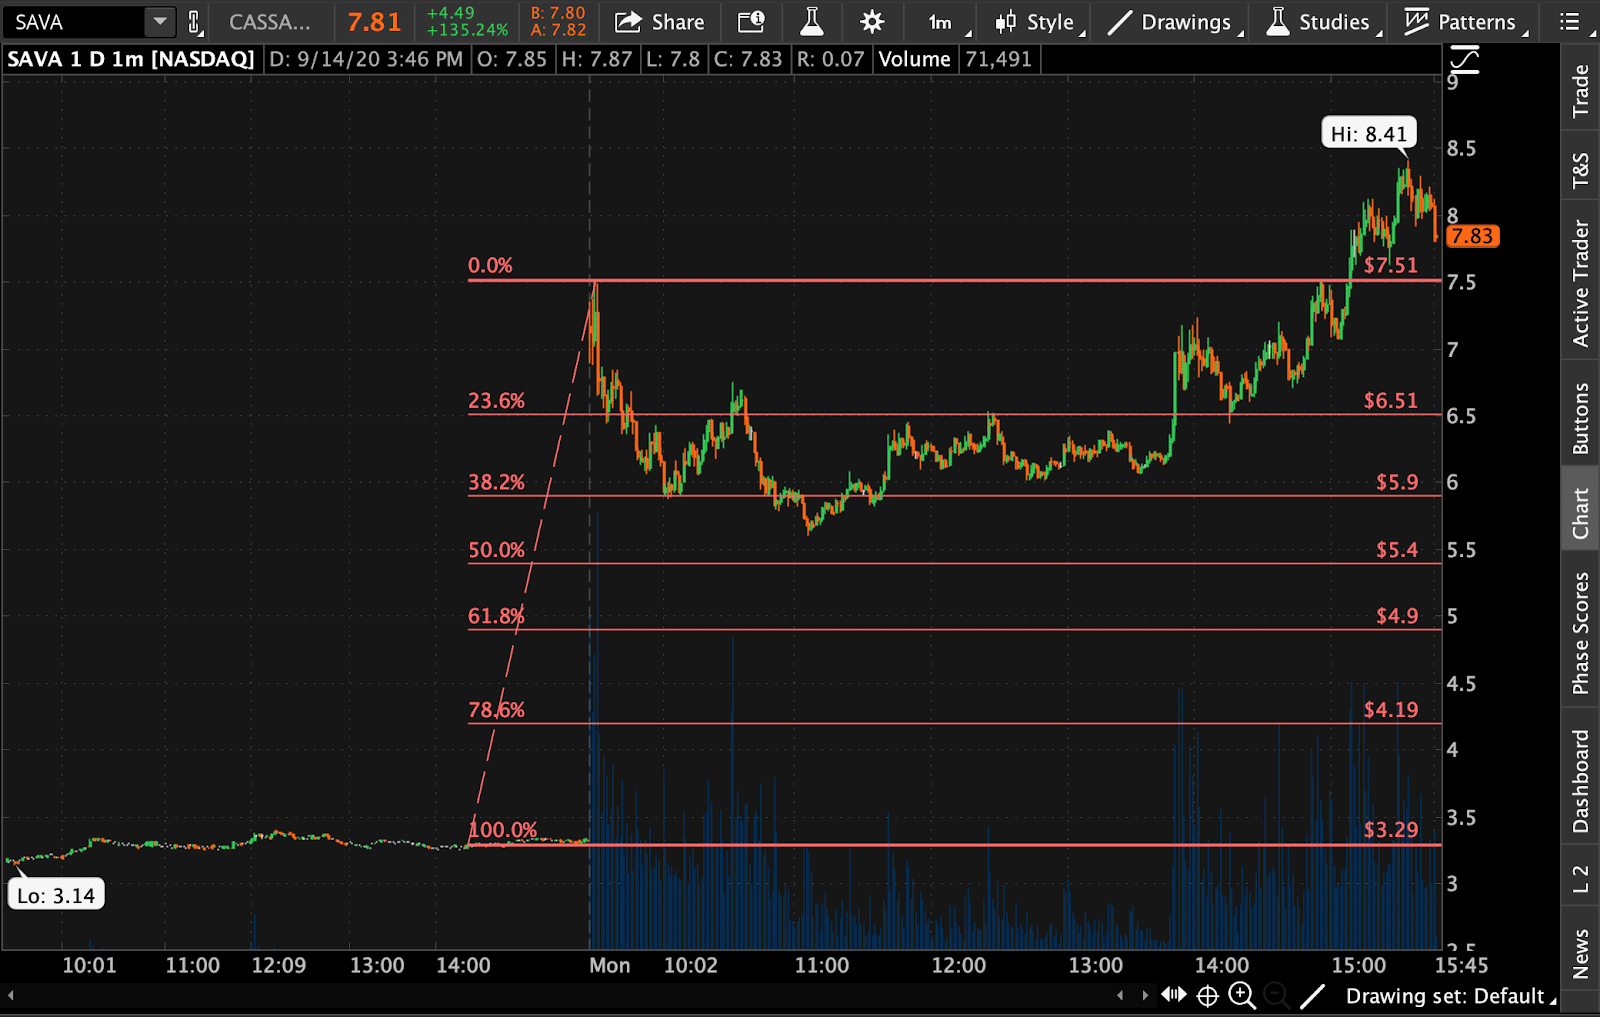
From that pattern, I was able to lock in about $7,500 in gains, or about a 40% return.
Listen, trading doesn’t have to be as difficult as you may think.
Let me show you how I make trading easier by focusing on chart patterns and price action.
After attending this important workshop, you’ll realize how utilizing chart patterns can save you time and help you develop the skills to become a better trader.
Register for the training session here.

0 Comments