If you know me, I love hunting down momentum stocks and uncovering breakouts.
Today, I want to show you what I believe to be the anatomy of a breakout trade with one of the most-talked-about stocks in the small-cap space recently — Aurora Cannabis (ACB).
The stock went from $5.30 to nearly $20 in just a few trading sessions…
And I want to show you how to spot potential breakouts because I actually saw it on my scanner, and alerted subscribers about it in an advance notice email.
Of course, I missed out on the trade… but that doesn’t mean I just forget about it and move on. I actually want to show you how I spotted it and what I could do better next time.
How To Spot Breakout Stocks
On Friday, May 15, cannabis stocks were rocketing… and here’s what I sent out to subscribers.
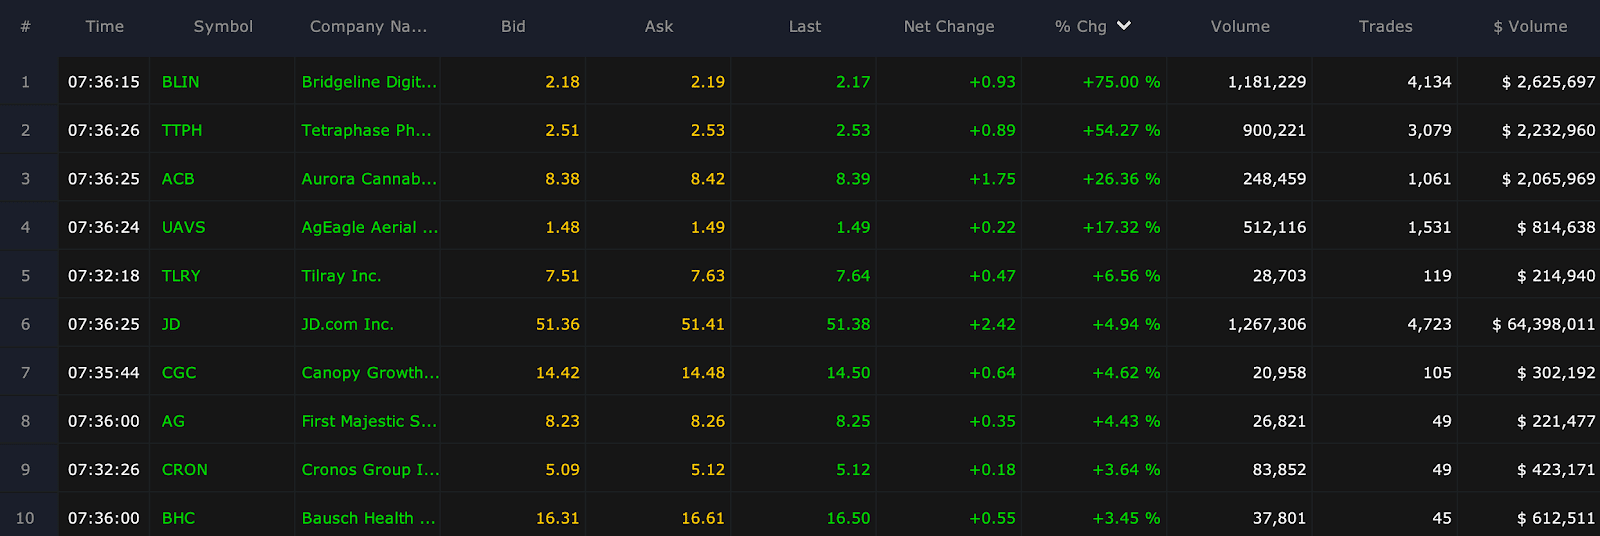
Cannabis stocks are rocketing higher Friday morning, despite U.S. stock futures being red. ACB, which I brought up in the advance notice alert of TLRY Thursday, is up 30% as I type.
TLRY, CRON and CGC all in the top ten.
It’s nice to wake up Friday morning and be in the #5 stock on all of Wall Street sorted by % gain with a minimum of $200,000 at 7:30 a.m. ET. Hell ya! I ended up buying 5,000 shares of TLRY, not 3,000, and my entry was smack dab in the middle of my $7 – $7.20 zone, picking them up at $7.09.
Good start to my day. The positive headlines flowing Thursday into Friday say it all.
ACB pot sales grew faster than expected and revenue beat forecasts. Then U.S. cannabis operator Green Thumb (GTBIF) reported tripling revenue as it pared down losses but shares don’t trade in the U.S. or it’d be on the board. But the point is it helps the sector and therefore TLRY. If I can get $.50 / share today or $3,500, I’d be happy with it but my goal is $1 / share as of right now.

Now, I was able to lock in about $3,000 in TLRY… but I actually want to learn from my mistake from not taking ACB.
With ACB, I spotted it on my scanner… and there was news in the name.
Prior to that, the company actually conducted a 1-for-12 reverse stock split. At one point, the stock was actually trading below $1 and in order to remain on the NYSE, it needed to trade above $1…
With the reverse split, it brought the stock price above $7.
With a reverse split, it actually reduces the float… and it can cause some wild swings, which was what happened with ACB in my opinion.
The thing is… it had legs because of two catalysts.
But I want to show you two chart patterns and how I could’ve traded it.

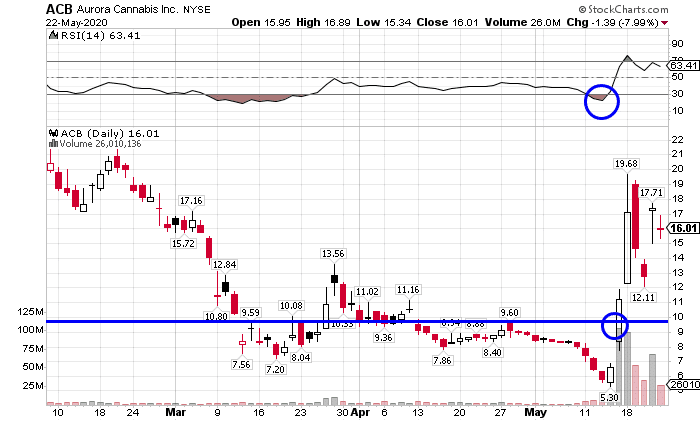
Chart Courtesy of StockCharts
Notice the blue horizontal line in ACB above?
Well, that was a key resistance level, now I could’ve played the breakout by purchasing shares above $9.60 and taken 10-20% profits.
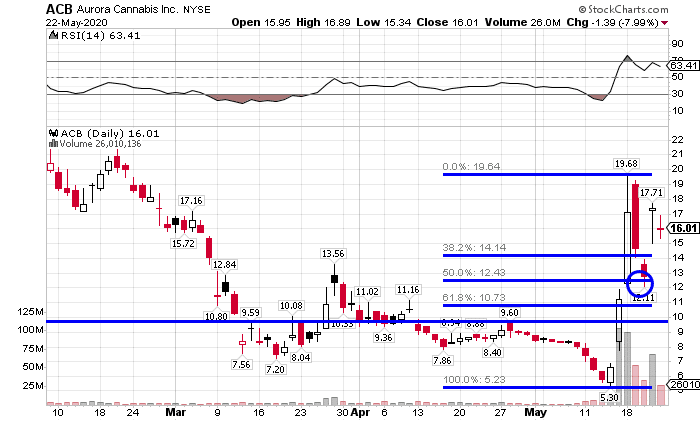
Another way I could’ve played it (if I missed the entire move to $19.68) would be to wait for the rest and retest pattern.
That’s when I would break out my Fibonacci retracement tool to identify key areas of value.

Chart Courtesy of StockCharts
Basically, I would identify the swing high and swing low and draw the Fibonacci retracement, thereafter I could see areas where I could’ve potentially entered the stock.
Here, I could’ve looked to buy shares at $12.43, right around the 50% retracement, which can be a support level… and looking for a 10-20% profit target.
Now, it does take some time to learn how to use these patterns… but that’s why I created this special training session…
That can potentially put you on the fast track to learning my part-time trading strategy…
And how I’m able to uncover momentum stocks poised to run.
Now, if you want to learn more about my strategy, click here to register now.

0 Comments