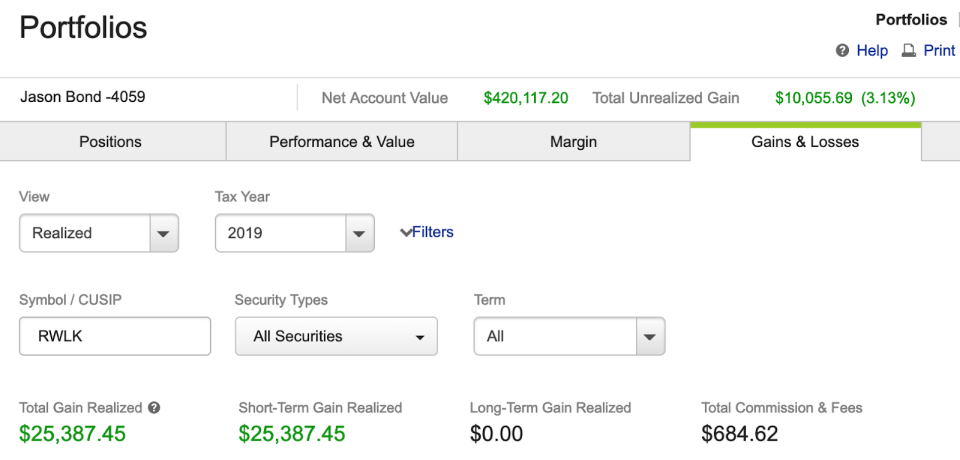
While stocks continue to defy the law of gravity… so does my PnL.
After, nearly doubling my $200K trading account in January… I’m at it again in February…
Now, I’m not showing you these numbers to brag. But because I have too.
You see, I teach ordinary people how to trade stocks. And in order to prove what I teach works, I trade real-money and live stream my trading account in real-time.
It’s full transparency…
…It’s having skin in the game.
And you know what?
I’m primarily trading stocks under ten bucks. Which means you don’t need a lot of money to get started.
To keep things easy, I focus on three specific chart patterns, identifying a catalyst, and finding value.
That’s it… rinse and repeat
It’s exactly what I teach my clients too.
Can it be taught?
Well, you can be the judge (taken from the live chat room):
Feb 13, 8:44 AM
W.B. : JB…. Huge gain on RWLK…. Wow. Someday soon, I’ll be able to buy in the quantities you do…. But for now I’ll take $800 profits overnight 😂😂😂
Feb 13, 8:47 AM
P.G. : Thanks JB…+3600 on RWLK….I sold it all taking gains
Feb 13, 8:51 AM
T.D. : Amazing JB sold mine for 3.5K profit. Been amazing week 8.5K of profits in barely 3 days. This is amazing
Feb 13, 8:52 AM
T.D. : Thanks to everyone for a brilliant start to my trading career. 14K profits in my 4 week of going live with real money.
Feb 13, 8:38 AM
C.G. : JB I’m new, when you say pivot in the email this am what do you mean?
Feb 13, 8:57 AM
Jason Bond (Moderator): @C.G. it’s an area of support or resistance, which if broken pivots the stock into a new trading range
I’m telling you…
This stuff works. And to prove it to you… I want to show you exactly how Millionaire Roadmap clients (some rookie traders) and myself were able to bank on one of today’s hottest stocks.
Spotting Chart Patterns, Value, and Catalysts
The reality is patterns, value, and catalysts work.
If you’re able to identify patterns and key areas of demand and supply, you could sound trading decisions. Moreover, when you position yourself and look for catalysts, it’s not crazy to see your positions gap up 25%+.
For example, check out the daily chart on ReWalk Robotics Ltd. (RWLK).
Does this pattern look similar?
If you said, “Yes! It does, I’ve seen you make money using this pattern before…”
Then, you’re right.
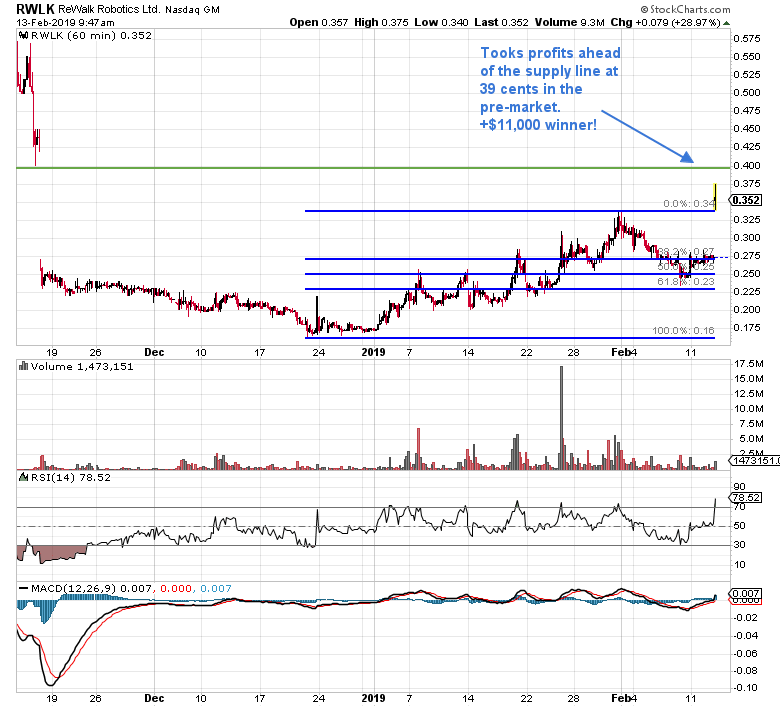
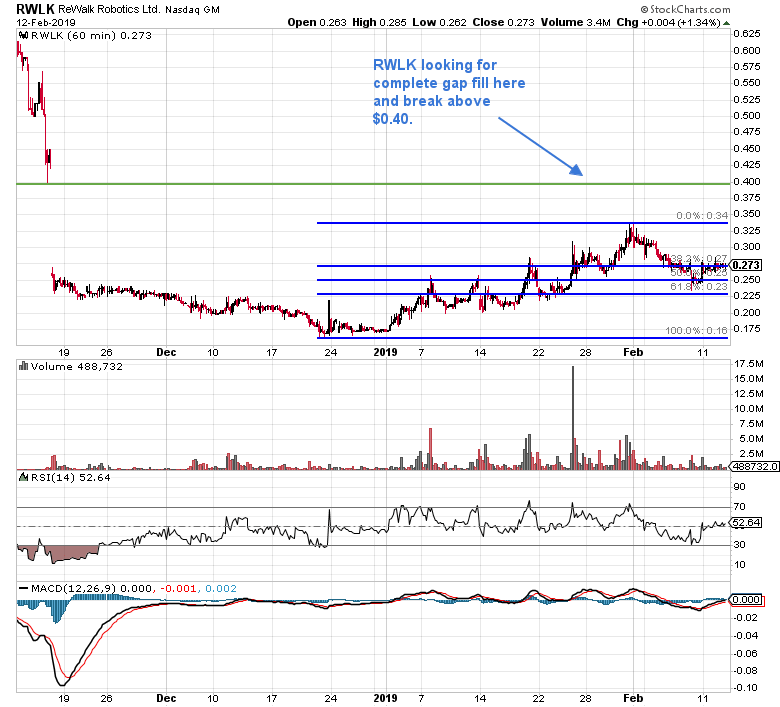
You see, I focus on three patterns – this pattern in RWLK is known as the Fibonacci retracement (what I call the rest and retest). It’s pretty simple. I wait for a stock to have a strong run up, just has RWLK did. Thereafter, I identify areas of value. You could’ve used $0.25 or $0.23 as buy areas.
The reason for these prices?
Those are areas of value. You see, looking at the Fibonacci retracement lines, those are areas of support, or demand. In other words, traders are willing to buy at the support (demand) area. In turn, this would drive the stock higher… you could clearly see the stock had a tough time breaking below 23 cents.
- Find the right chart patterns and what works for you. I like to focus on my three patterns – oversold (fish hook), continuation (Fibonacci retracement or rest and retest), breakout (rocket).
- Identify areas of value. That means buying at clear support or demand areas and taking profits before it reaches an area of supply.
- Be aware of catalyst events.
You see, I’ve already completed two of the steps in my trading process.
The next step is the catalysts.
Identifying Bullish Catalysts
Now, RWLK actually had two potential bullish catalysts:
- FDA submission under review for its new product.RWLK is developing and intended to commercialize a lightweight soft suit exoskeleton.RWLK CEO noted on an earnings call, “At the end of October, we achieved a major milestone with our ReStore program, our new breakthrough product for stroke patients. We have completed patient enrollment in our ReStore clinical trial and have met the study accrual objectives. We are now moving to complete the clinical study data reports to support our 510(k) submission, and we are on track to file with the FDA around year-end”
In a press release a few months ago (which I noted in a report that I sent out to Millionaire Roadmap members in mid-January), RWLK stated, “With our clinical study accrual now completed, we plan to finalize our ReStore submission to the U.S Food and Drug Administration shortly.”
My thinking was this was related to the government shutdown, and once it starts operating normally… this stock would explode.
- Increased reimbursements from insurance companies.Since insurance companies were looking to reimburse more on RWLK’s exoskeletons, then its revenues would increase.RWLK CEO noted, “We are encouraged by the trend we are seeing and believe this will meaningfully contribute to growth in sales in the coming quarters. Demand from the system remains strong as request for authorizations among new applications under the American Health Care Act in the United States have averaged 25 per quarter and are expected to be over 100 for the year.”
The CEO noted, “The number of German requests for authorizations under the new MDC code are expected to reach 43 for the year. Based on this, we expect Q4 sales to be in the range of $2 million to $3 million pending timing of insurance conversions.”
Once You’ve Conducted Your Due Diligence… It’s Time to Fire.
Now, there was plenty of time to get into the trade and game plan. Once I saw its price and volume increase, I was stalking the stock.
Here’s the chart I was actually looking at ahead of this trade.
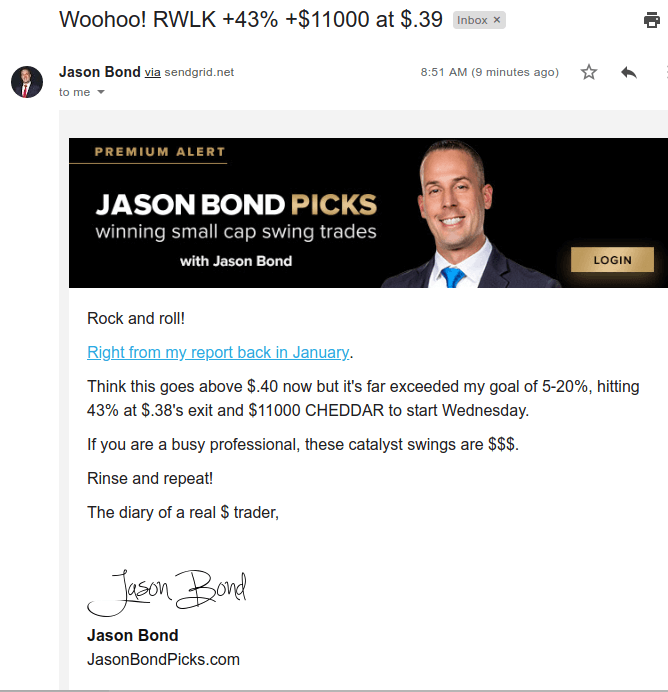
I alerted Millionaire Roadmap clients about this trade…
Not too long after, I was locking in +43% in profits, well above my expected goal of 5-20%.
Could I have held the stock longer in hopes of making more money? Of course. Now, I know I thought it could break above 40 cents. However, if you really break the trade down… it exceeded my profit expectations significantly, and it made sense to take $11,000 in profits.
Of course, if you want to see how this all works in real-time, click here to gain access.


0 Comments