Have you ever seen a stock explode higher…
Think you would miss out on the trade, and just slam into shares because you don’t want to get left behind…
Only for the stock to watch the stock pull back and blow through your stop, and you’re forced to dump your position?
If that sounds familiar to you, I believe there’s a quick fix — and it just so happens to be one of my favorite chart patterns to utilize to buy the dips in momentum stocks.
In fact, I actually use it very frequently, and I want to teach you how to use it.
How I Utilized This Chart Pattern To Lock In ~$2,900 On BlackBerry (BB)
If you haven’t heard the news yet Amazon (AMZN) is set to help BlackBerry develop its data and analytics platform.
As one can imagine, that’s huge for the stock and momentum traders were all over it.
I mean the stock moved from the $5 – $6 range all the way to $9.69. Of course, some traders got caught in the wild price action.
Heck, some traders bought the top and watch it drop shortly after.
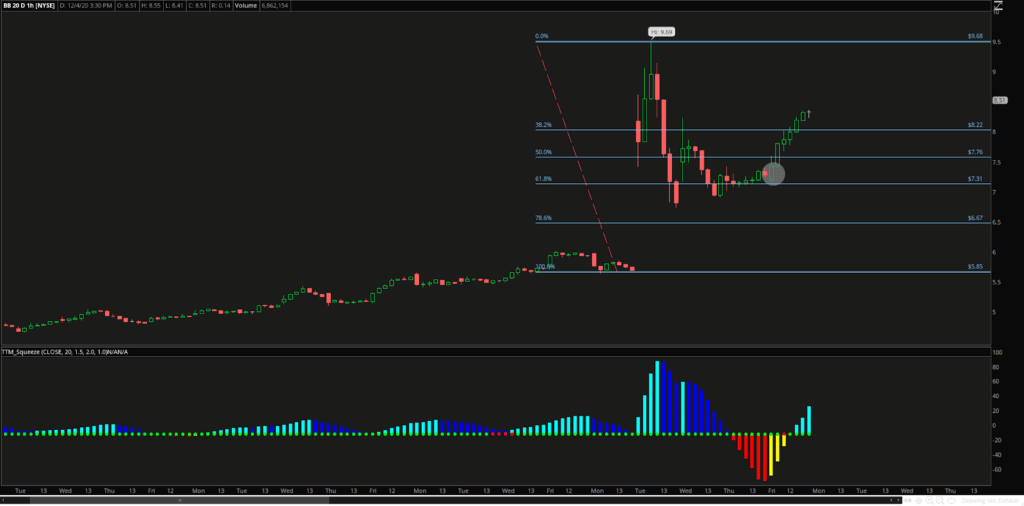
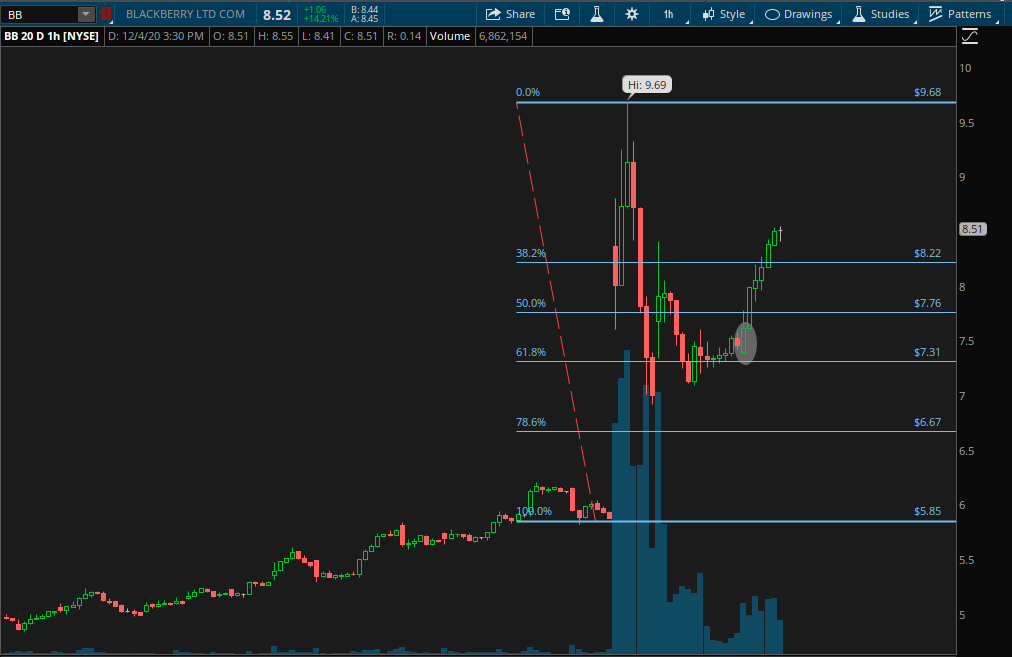
Here’s a look at the price action.

Don’t worry, it’ll make sense after.
When I’m looking for areas to potentially enter a momentum stock that’s just had a massive move, I love to use the Fibonacci retracement tool.
Why?
It’s simple for me.
I find the low point (where the move started) and the high point (the top of the move just as the stock starts to pull back).
With BB, this was $5.85 or so and $9.69. My charting software did the rest of the work to help me identify key levels.

With the Fibonacci retracement pattern, I tend to focus on the 38.2%, 50%, and 61.8%. So if you look at what BB did around the 61.8% area, you can imagine how strong that support level is.
The stock tried to break below it twice, but it couldn’t stay below.
This is where I look for an entry, just as the stock starts to run higher.
Notice that encircled area?
Well, I purchased shares at $7.59 with a 5-10% goal. I sent out that alert on Dec. 4 at 9:43 AM ET.
I mean, if you just look at the chart, you can probably guess how that trade turned out. If you guessed it was a winner, you’re correct!
At 11:29 AM ET that day, I sold my shares at $7.87 for a $2,900 winner.
Now, that’s just one pattern in my trading arsenal.
Right now, chart patterns are what’s working and if you can identify them, I believe it’s possible to uncover some attractive returns in a relatively short period.
Not only that, but chart patterns can help you better plan your trades.
*Results presented are not typical and may vary from person to person. Please see our full disclaimer here: ragingbull.com/disclaimer

0 Comments