With the presidential election in just four days, traders will be antsy…
And who knows, maybe we’ll see a lot more risk-off sentiment heading into a pivotal moment for the market. Who knows, I can only speculate.
In this market environment, traders will either:
- Take their positions off the table and move to cash.
- Hold through the choppy waters and maintain their outlook
- Hedge their positions heading into this coin-toss of an event.
- Go on the offensive and hunt down trading opportunities.
Right now, I don’t think it’s the time to turn away from the market. Instead, I want to be on the hunt for money-making opportunities…
And there’s one area I’ll continue to attack…
Small-Cap Momentum Stocks
You see, I have more than a decade of experience trading these stocks, and there’s one factor that matters — price action.
If you have just a few patterns to rely on, I truly believe you can attack the market even during one of the most uncertain times.
That said, let me show you how I identify these plays, and why you’ll want to learn how to recognize patterns right now.
If You’re Not Focused On Price Action Now, Then Listen Up
For those of you who don’t remember, the night of the last election, futures were down over a thousand points as everyone expected Clinton to win, but when it became clear Trump would pull an upset, futures were green by morning.
Nobody knows what Tuesday night will bring, and it’s really a coin toss on what will happen. With the coming election, I want to take a step back because I can’t get a good read on the overall market.
That doesn’t mean I won’t be on the hunt for opportunities.
In fact, after the last election, I relied on my best chart patterns — I intend to do the same after the election. In my opinion, now’s the time to learn how to attack the market with chart patterns.
Here’s how it starts for small-cap momentum stocks.
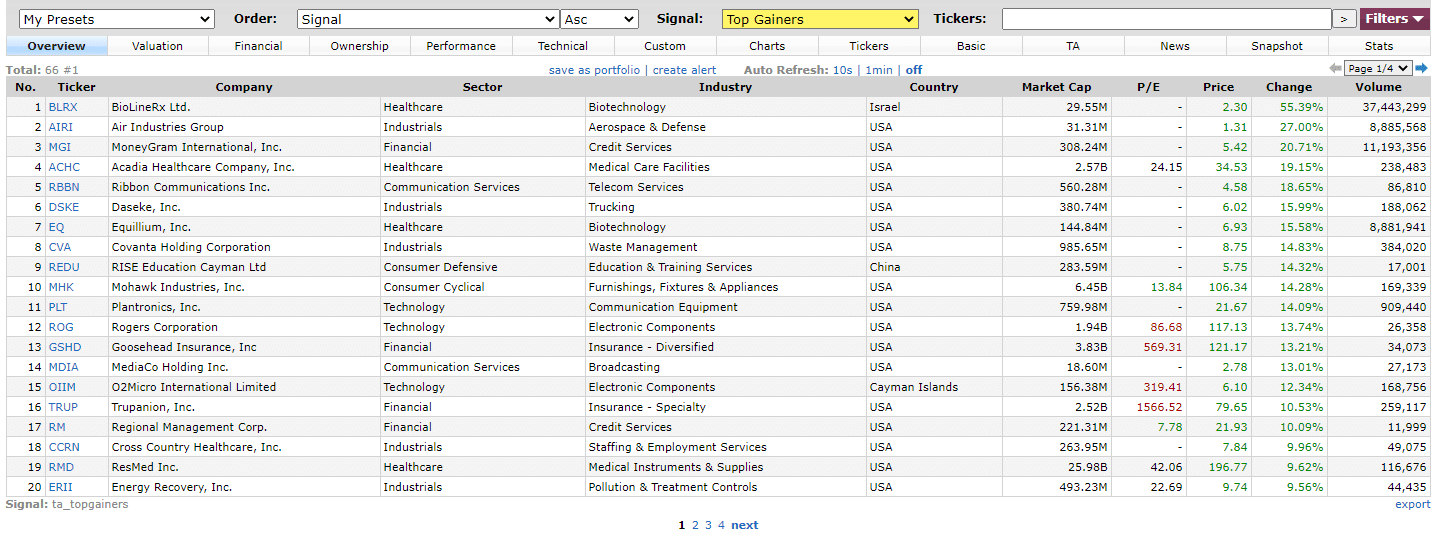
I’ll filter for momentum stocks gapping higher. So one quick way to do that is to look to Finviz, if you don’t have a scanner handy.
If you look under “Top Gainers”, you’ll notice a screenshot such as the one below.

Once I find top gainers with heavy dollar volume, I want to see if my chart patterns come up. If you don’t know what dollar volume is, it’s simply the price multiplied by the number of shares traded. I want to look for stocks with at least $2M in dollar volume. This lets me know there’s liquidity and potential juice behind the move.
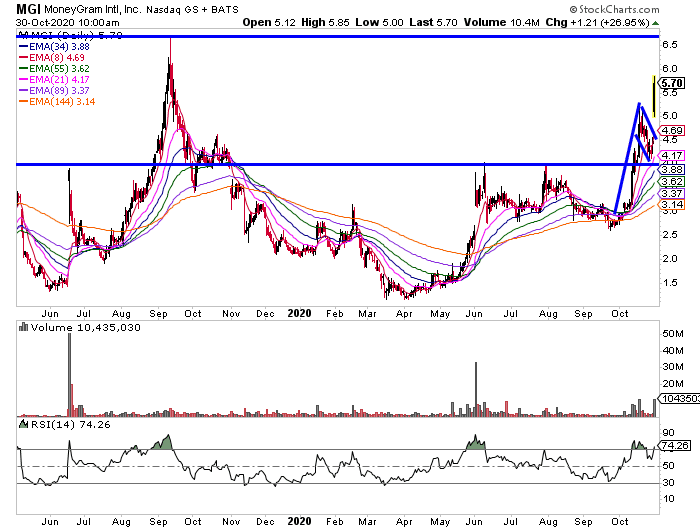
For example, MoneyGram International Inc (MGI) took off after reporting earnings.
Prior to the release…

MGI actually formed a bull flag / pennant pattern. Typically, when I notice this pattern, the stock breaks out.
That happened with MGI.
This is one pattern I’ll look to utilize after the election.
Another pattern I’ll look for is my fish hook. This helps me uncover plays for a potential bounce.
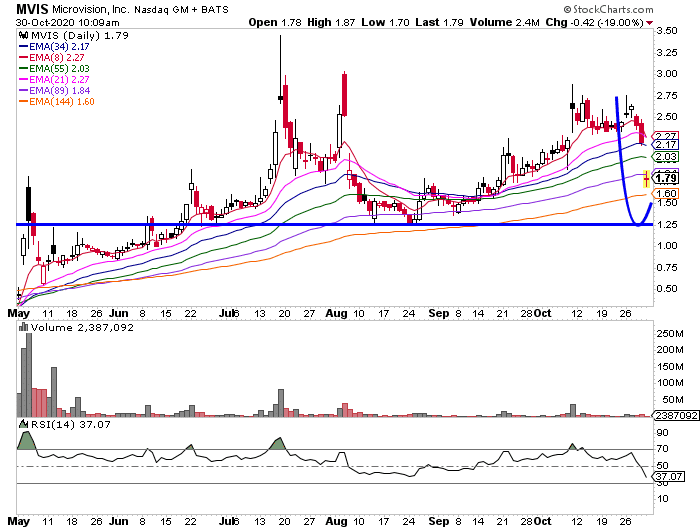
For example, Microvision (MVIS) had earnings and it’s selling off. With the fish hook pattern, I want to remain patient and wait for key levels to come up.

With MVIS, some key levels to focus on are $1.60 (the 144-day exponential moving average) and $1.25 (a key inflection point).
If MVIS holds and starts to catch a bid around those levels, then it indicates it’s in the fish hook pattern and it can run higher.
Of course, there’s more to it when it comes to identifying these chart patterns…
That’s why I put together this important training session to get you ready for the election.
You’ll learn my two favorite patterns that I believe can help identify opportunities come next week, and navigate the markets with an edge.
Register for the training session here.

0 Comments