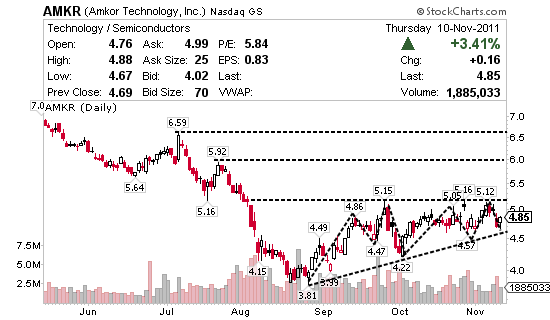
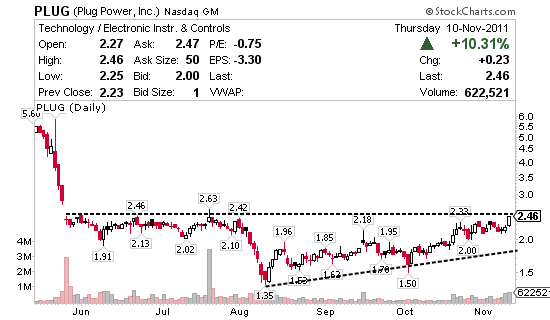
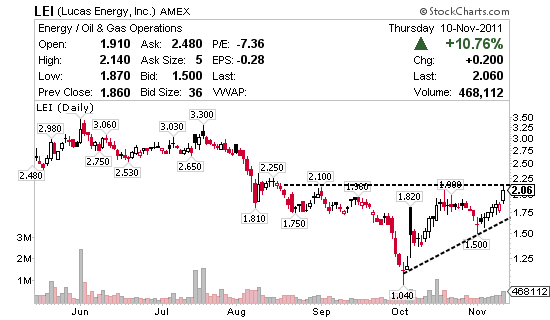
Each day I sort through hundreds of charts using filters form EquityFeed to find my favorite technical setups. Once my watch list is developed. I start research looking for short term catalysts needed to spark a new move. The triangles below are known for higher lows of support with a top trend line of resistance. Essentially traders are buying the dips at higher levels over the course of time as the price continues to wear down the sellers at a top resistance line. As the lows approach the apex of the hypotenuse shares often pop through the top trend line and trade at a new level. Here are 3 charts below from a long list that I’m keeping an eye on.
Amkor Technology, Inc. (NASDAQ:AMKR) provides outsourced semiconductor packaging and test services in the United States and internationally. Last reported short interest is 5.4 days to cover settlement date 10/31/11. Currently trading in an ascending triangle the stock continues to make higher lows as it approaches a break of the $5.15 range. After $5.15 the next reasonable resistance is $5.92 just below $6.00. The breakout could be slowed by their recent report of revenue and income falling in Q3, as demand has slackened in some computer and technology sectors.
Plug Power Inc., (NASDAQ:PLUG) an alternative energy technology provider, involves in the design, development, commercialization, and manufacture of fuel cell systems for the industrial off-road markets and stationary power markets worldwide. They just reported a $6.3 million net loss, or 28 cents a share, compared with a net loss of $9.3 million, or 71 cents a share, for the same period last year. Revenue of $5.5 million for the quarter, down slightly from $5.8 million a year ago. Shares have not traded above the $2.45 range in quite some time but appears ready to breakout soon. If a pullback occurs, one strategy is to add of the bottom trend line and play for the breakout. Another would be to play the breakout from this level. In either case, the company outlook appears strong enough for PLUG to be trading above this recent range in the short term.
Unlike the other two stocks I’ve mentioned above, Lucas Energy, Inc. (AMEX:LEI) has yet to report their earnings. The triangle chart pattern below probably isn’t as reliable as the charts above primarily because the higher lows are more volatile and less frequent. Still we see shares walking up prior to earnings and challenging some key resistance points at $2.00 to $2.10. My thought is shares will trade sideways from $2.00 to $2.25 before earnings and if they report solid numbers a breakout into a new trading range.


0 Comments