Good morning,
Stocks slid this week on profit-taking and concerns stemming from the Brexit-Trump-like vote that had been anticipated on Sunday in Italy. At the close of trading Friday, the DJIA rose 0.10%, bucking the trend down in the broader averages, especially technology and small-cap names. The S&P 500, Nasdaq and Russell 2000 fell 0.97%, 2.65% and 2.45%, respectively.
And the Friday’s jobs report didn’t play much of a roll in trading on Friday.
Oddly enough, however, the VIX barely moved, closing at a rather modest 14.12 points on Friday. For the fourth straight week, the VIX has closed below its 52-week moving average, and significantly lower than the four-year average of 19.5.
West Texas Intermediate Crude (WTIC) soared this week by $5.62 (12.20%) per barrel to $51.68, following an announcement of the OPEC cartel reaching a deal to meaningfully production cuts.
A report by Russia Today that Russian president Vladimir Putin was behind the OPEC deal may have inspired traders to come back into the market with more confidence. And as I stated in previous LT Reports, if OPEC is able to get its act together, a $60 per barrel for WTIC is now possible in 2017.
To wit:
In addition to what has already been baked into the cake, if OPEC was to get its act together and agree upon cutting production by as much as a million barrels per day, I’m confident we’ll see $60 oil in a short-term time horizon.
The Commodities Research Bureau Index (CRB) rose a strong 3.21% to close at 191.69, up three straight weeks, and up 23.8% from the January low of 154.85.
Folks, we may see some more consumer price inflation next year.
Two prominent and respected market players (of mine, too) issued a warning this week about stock valuations. One warning came from Jeff Gundlach of DoubleLine Capital and the other, Bill Gross, from Janus Global Funds. Both men have issued warnings about stock valuations throughout 2016.
Let’s focus upon Grundlach’s comments, as his are more interesting and consistent with my view of how the financial world works, and consistent with discussions I’ve had with my readers since the election (and a bit further back).
“The bar was so low on Trump to the point people were expecting markets will go down 80 percent and global depression – and now this guy is the Wizard of Oz and so expectations are high,” Gundlach told Reuters. “There’s no magic here.”
“There is going to be a buyer’s remorse period,” said Gundlach, who predicted a Trump win in the presidential election.
“The dollar is going to go down, yields have peaked and will move sideways,” he added. “Stocks have peaked as well and gold is going to go up in the short term.”
“I am less defensive now on Treasuries, and I am less negative on the 10-year Treasury note at a 2.35% yield than we were at 1.35% yield,” he said. “Bank of America’s dividend yield is 1.39%, while the 3-year Treasury yield is 1.45%. I mean, really?”
Grundlach goes on to advise selling the FANG stocks and technologies, in general, and to buy stocks who make real things. I say, “Ditto.”
And as far as Grundlach’s comment, comparing Bank of America’s dividend yield of 1.39% and the US Treasury note yield of 1.45%. I say, “Spot on.” I’ve been watching the US Treasury market and making the comparison between Treasury yields and stock yields since Trump was elected.
And what’s the yield comparison today between the US Treasury 10-year note and the DJIA? The 10-year closed at 2.40% on Friday, and the yield on the DJIA is 2.80%. I mean, really?
Moreover, the P/E ratio of the DJIA is 20.93, as of Friday. Yes, I know it’s not a forward-looking metric, but earnings for the DJIA aren’t expected to climb much, if at all, in 2017. In fact, much of the rise in the per-share earning numbers of the past seven-plus years can be attributable to aggressive buyback programs.
And where have these 30 companies been getting the cash to buyback stock? Sure, some has come from their respective treasuries, but at the same time many of these companies are also levering up their balance sheets with cheap debt.
Well, debt isn’t cheap anymore.
So, now I see headwinds coming from two directions, at least. One headwind will come from many pension funds, hedge funds, high-worth individuals and sovereigns opting for US Treasuries at these interest rate levels instead of callable commercial paper and dividend-yielding blue-chip equities.
The other headwind will come from downward pressure on per-share earnings, as more companies on the margin seek to de-leverage or maintain present leverage on the liability side of the balance sheet instead of levering up.
The possible third headwind is the US economy, or better yet, the global economy, which is not exactly firing on all cylinders. Western economies are barely growing at the growth rate of populations throughout the Western world, and aging demographics make matters that much more difficult to achieve meaningful GDP growth.
Europe and the US economies are projected to achieve less than 2% growth, in real terms, a projected rate I think is bogus. Downward projections to GDP rates are the norm, not the exception. And the adjustment to growth to account for consumer price inflation is suspect, as well.
“The dollar is going to go down, yields have peaked and will move sideways, stocks have peaked as well and gold is going to go up in the short term,” Grundlach proffered.
Okay, and as promised from last week’s report, I’ll briefly cover the yen carry trade as it relates to stocks, interest rates and gold, as Grundlach conveniently broaches the latest as a segue to my point about the yen and comments recently made by Jim of Deutsche Bank, who stated in a letter to clients:
For 2017 we think they will but the debate over the funding of increases in US (and perhaps UK) fiscal spending will increase over the next 12 months and is likely to lead to more volatility as the financial market swings from believing that fiscal spending will lead to higher growth, inflation and higher yields for a period of time to perhaps then believing that global central banks are likely to cap the rise in yields.
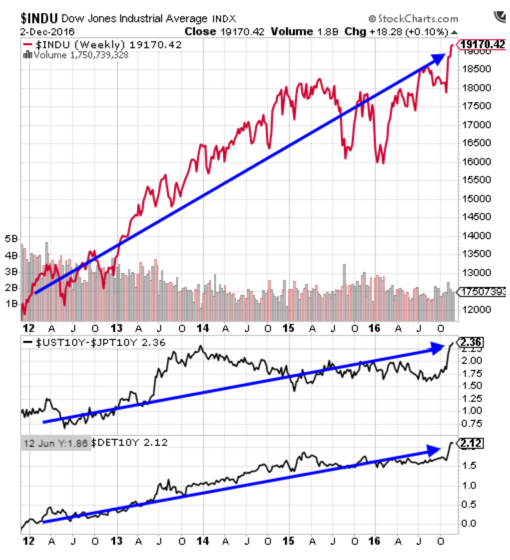
Now, look at the two charts I asked my colleague in arms, Jeff Williams, to construct for this week’s LT Report. The first chart, below, shows the importance of maintaining an adequate spread between the US 10-year Treasury and the Japanese 10-year equivalent (and German 10-year Bund, as an additional component).
Do you see the foundation for the yen carry trade now? By borrowing (selling) Japan’s 10-year yield of 0.04% (as of Friday’s close), traders are able to arbitrage the higher rate through the purchase of the US 10-year Treasury. And as long as the BoJ maintains the 10-year rate at ZIRP, enough buyers should come in to cap the rate on the US 10-year Treasury note. That’s what Gundlach and Reid are talking about, with the added comment about the comparison I’ve made about the squeezed dividend yield spread between the DJIA and US 10-year Treasury note that more convincing that Grundlach and Reid are with me on this point.
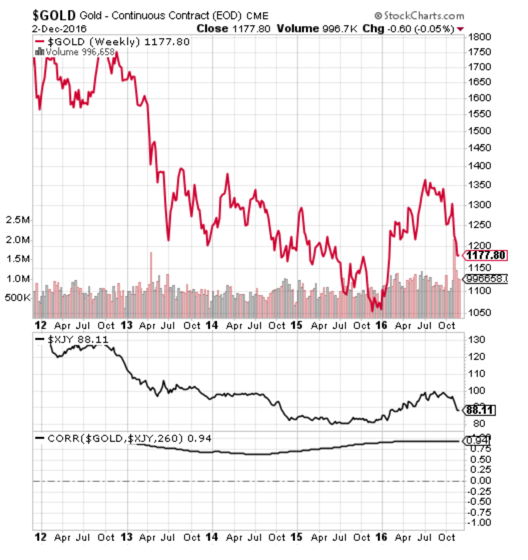
Okay, now let’s move on to Grundlach’s comment about the gold price. The second chart, below, most likely demonstrates cause and effect in the gold market, driven by the yen carry trade, with the caveat that correlation doesn’t necessarily prove causation. Right?
Notice when the spread between the yield on the 10-year Treasury and 10-year Japanese equivalent narrows somewhere close to 100 basis points (1.00%). Safe haven and ‘gold-basis’ traders opt for gold at this meager spread.
What Grundlach suggests is, that as the spread narrows between the two debt assets, the dollar-gold price should get a lift. That’s what I expect in the near future, a narrowing of the spread and rising dollar-gold prices, maybe as soon as the FOMC meeting scheduled for December 13, 14. We’ll see.
And another look at the yen carry trade from the point of view of the yen cross against the US dollar is heavily implied, as well (see chart, below).
Hello? The five-year weekly closing price of the dollar/yen crosses and dollar-gold prices correlates at 0.94! That’s as close as you’re going to get to a perfect correlation coefficient of 1.00, the max. And since the dollar/yen is technically very oversold, the gold price very oversold, and the US dollar very overbought, it appears that I’m more than just a pretty face, hanging around Vegas casinos. I hope.
Bottom line: exercise caution with your long index trades, although I expect sideways action in stocks as the most likely scenario in the coming months until the “buyer’s remorse,” as Grundlach puts it, begins to creep into the market. But, we’re not there, yet. Trump hasn’t even been sworn in, yet.
Okay, let’s talk stocks. We had some good activity this week.
This Week’s JBP Stock Ideas
BALLARD POWER SYSTEMS (BLDP)
As alerted, I’m in 30,000 shares of BLDP at an average price of $2.16. The thesis, here.
BLDP closed the week down $0.07 to $1.88.
On November 29, Ballard Power announced it had signed a long-term sales agreement with Solaris Bus & Coach, a bus OEM, headquartered in Poland. Under the terms of the agreement, Ballard Power will supply fuel cell modules to Solaris in Europe. Deliveries are expected to start in 2017.
I continue to hold the stock, as it is the best-positioned and managed company in the fuel cells space, with prospects of making a deal with leading electric automaker most likely when compared with the chances of losing a major deal to the company’s competition.
So far, as a trading stock, watching BLDP is akin to watching paint dry, but may also become a pleasant site to see when news or a rumor of an electric automaker (Tesla?) seen entering Ballard’s front door reaches the market. And even a rumor may jolt this stock, because Wall Street knows that Ballard is the only likely company to be offered a deal from a big automaker.
ABOUT BALLARD POWER SYSTEMS (BLDP)
Ballard Power Systems Inc. engages in the development and commercialization of proton exchange membrane fuel cells worldwide. It is primarily involved in the design, development, manufacture, sale, and service of fuel cell stacks, modules, and systems for various applications. The company also develops methanol clean energy backup power systems, as well as provides engineering services for various fuel cell applications. Ballard Power Systems Inc. offers its fuel cell products for various applications, including portable power, material handling, and telecom backup power, as well as power product markets of bus and tram applications. Source: Finviz.com
GLU MOBILE (GLUU)
Glu Mobile (GLUU) has been on my Watch List since October 31, when the stock reached a low of $1.86, leading up to the company’s earnings report of November 3. The report was less than inspiring, dropping the stock to as low as $1.73.
Since the post-earnings low of $1.73, GLUU rebounded by 22.5% to close Friday’s trade at $2.12 per share, down $0.11 (-4.93%) for the week. After trading within pennies of its 52-week moving average, selling commenced. I expect the stock to trade within the $2.00 and $2.50 range until a break in the company is announced.
Insiders have been buying the stock at levels higher than the usual window dressing amounts following a transition of a new CEO.
As I’ve stated, I’ve added GLUU to my Watch List, because the company has been doing well with its releases, including Tap Sports, Cooking Dash and Deer Hunter. However, I and, apparently, the market are expecting another hit from Glu, akin to the company’s big hit, Kim Kardashian: Hollywood, before the stock flied again.
Glu’s balance sheet is loaded with cash, allowing opportunities to acquire franchises, such as the recent acquisition of Crowdstar, but more importantly an opportunity to snag a large and potentially prosperous franchise suitable to Glu more than its much larger competitors, Zynga (ZNGA) and Electronic Arts (EA).
Analyst upgrades, including Piper Jaffray, Cowen & Co., Canaccord Genuity, Roth Capital and Wedbush, all of whom issued price targets ranging from a minimum price target of $2.00 per share, with an average of $3.03.
This week, Canaccord reiterated a “Hold.”
ABOUT GLU MOBILE (GLUU)
Glu Mobile Inc. develops, publishes, and markets a portfolio of games for the smartphones and tablet devices users. The company offers free-to-play action, celebrity, sports, and simulation genre mobile games. It creates games based on its own brands, including Contract Killer, Cooking Dash, Deer Hunter, Diner Dash, Eternity Warriors, Frontline Commando, Gun Bros, Heroes of Destiny, Racing Rivals, Tap Sports Baseball, and Tap Sports Football. The company also creates games based on third-party licensed brands, such as Kim Kardashian: Hollywood, Kendall and Kylie, Katy Perry Pop, James Bond: World of Espionage, Mission Impossible: Rogue Nation, and Sniper X With Jason Statham.
LENDINGCLUB (LC)
After two weeks of gains following the company’s earnings release of +9.15% and +19.69%, LC has since dropped three consecutive weeks, with the latest week’s drop of $0.79 (-13.30%) to $5.15 per share recorded as the worst week since the company’s scandal in early May. This nasty drop was the result of a denial from the company’s CEO that Goldman Sachs had approached LendingClub for an acquisition.
At $5.15 per share, the stock’s price is definitely more appealing, but the stock’s price trajectory is still down along with the trend of its 52-week moving average. I’m watching the stock for signs of finding a bottom from the recent pullback.
My tentative target is $7, which may allow me a good profit at a purchase price closer to $5.00. I’ll let you know. I’ll be watching for opportunities in LC and other stocks during any broad-based sell off in the major averages.
ABOUT LENDING CLUB (LC)
LendingClub Corporation, together with its subsidiaries, operates as an online marketplace that connects borrowers and investors in the United States. Its marketplace facilitates various types of loan products for consumers and small businesses, including unsecured personal loans, super prime consumer loans, unsecured education and patient finance loans, and unsecured small business loans. The company also offers investors an opportunity to invest in a range of loans based on term and credit characteristics. It serves investors, such as retail investors, high-net-worth individuals and family offices, banks and finance companies, insurance companies, hedge funds, foundations, pension plans, and university endowments.
TWITTER (TWTR)
On November 5, I alerted a Call position I took in TWTR.
The idea at that time:
The monthly Call, with an expiry of March ’17, and a strike price of $20 can be bought for $1.40 per contract. Buying 10 Calls limits your loss to $1,400. So far, the open interest of the March ‘17 contract is 43.23k, an active and popular strike price.
To read my rationale for the Twitter Call, follow the link to my report: ‘Twitter Takeover Play’.
My bet with a Call option includes the possibility a suitor who can fix Twitter’s sluggish attempt to monetize the company better will strike by the expiration of my March 2017 Call.
At the close of Friday’s trade, the contract closed at $1.27. I’m still ‘out of the money’.
ABOUT TWITTER (TWTR)
Twitter, Inc. operates as a global platform for public self-expression and conversation in real time. The company offers various products and services, including Twitter that allows users to create, distribute, and discover content; and Periscope and Vine, a mobile application that enables user to broadcast and watch video live. It also provides promoted products and services, such as promoted tweets, promoted accounts, and promoted trends that enable its advertisers to promote their brands, products, and services; and subscription access to its data feed for data partners.
INVITAE (NVTA)
Invitae sells genetic testing as a diagnostic tool, a business with double-digit growth potential as new technologies rapidly reduce costs. The trend of using genetics information for the purpose of diagnosis is soaring, with more than 2,000 separate tests now available to determine genetic predisposition to medical disease or condition.
The rationale behind this stock idea is, that the company seeks to lower the cost of genetic testing enough to aid medical professionals with quicker and cost-effective diagnoses, a goal third-party payers have been welcoming with open arms.
Revenue has increased in each quarter since the company began trading on the Nasdaq in Q1 of 2014, with oncology (cancer) testing as the company’s bread-and-butter business—a business which is growing at more than 200% per annum at the company.
Management expects to become cash-flow positive by 2018, as the growth rate of billable testing has doubled (y-o-y), revenue has nearly tripled, while gross margins have steadily declined.
At the company’s present billing rate, I expect revenue to easily reach $100 million by the close of 2017, as the number of covered lives (insurance) is expected to increase to 160 million lives by the close of this year, up from 65 million lives in Q3, 41 million lives in Q2, and 5.5 million lives in Q1. Wow.
So far, Invitae’s performance has been astounding, and I expect further blockbuster growth for the company as the level of awareness of the value of its services increases while costs decline. The company is slated to become the industry leader early on during this new and fast-growing marketplace.
Invitae has a market cap of $275 million and $71 million of cash. A secondary offering of $40 million was recently completed at $6 per share, allowing the company a lot of breathing room for many quarters to come. I don’t expect any stock dilution, going forward.
Healthcare investors, Baker Brothers Advisors, is the top shareholder, at 6.55 million shares. I like that. Baker Brothers has a good reputation for specializing in healthcare stocks, and done well for its investors.
See Invitae Investor Presentation
NVTA is on my Watch List for accumulation or to make a trade at, maybe, $6.00, a price of which may become likely during any significant pullback in the major averages.
UNDER ARMOUR (UA)
Under Armour is the latest iconic company to fall out of favor after several years under the influence of pop-culture hipness. The company’s Q3 earnings report resulted in a 20% down day to the stock price, following a restatement of guidance that included the company’s expectations of falling short of reaching its previously stated $800 million profit target for 2018.
The reason for the shortfall intrigued me enough to look into the particulars of this company, which eventually led me to my overall thumbs-up conclusion. According to company CEO Kevin Plank, instead of broadening its reach within a saturated U.S. market, Under Armour instead has embarked on plans to expand internationally with an increased focus on the footwear market.
In addition, capital improvements in manufacturing processes and an introduction of a new line of sportswear is in store for investors who take a longer-term approach to this stock. Chances are the company may succeed in no less of spectacular fashion than it has succeeded before.
Another interesting market that Under Armour may disrupt is the ‘comprehensive fitness analysis market’, a niche market of both amateur and professional athletes that also comes with high margin merchandise for the company. Working from the company’s “the Band” product, Under Armor is in the process of integrating a heart-rate monitor, body-fat sensor, and a fitness-tracking app to offer a complete fitness analysis system to this market.
I like Under Armour for its proven ability to innovate and carve out market share with the introduction of new ideas and its ability uncover hidden markets. And because of the recent drop in the share price, I’ll be considering buying some shares of a company that, in my opinion, really hasn’t changed. Only the price of the stock has changed—to a discount from a previously expensive stock. And the company’s revenue forecast of $7.5 billion for 2018 hasn’t changed, either.
Technically, too, the stock appears to have reached an “oversold” price. I’ll let you know if/when I pull the trigger on UA. Action taken on some of the stocks on my Watch List depend upon overall market sentiment in the coming weeks. UA is one of those stocks.
NEW GOLD (NGD)
Gold stock are coming back into favor once again after five years of trading in a bear market. Since bottoming in the November-January time period, gold stocks have led all major market sectors to much higher prices. NGD has certainly offered more than its fair share to holders of the stock, with a tripling in price to as high as $6.04 in August from the $2.00 low in January. The stock has since fallen back to $3.63 due to the fall in gold prices from the July highs.
Of course, when the gold price dropped from the peak of $1,377.50 in July to today’s $1,177 price, the gold stocks followed. This makes sense and has been the pattern in the gold market and other ‘commodities’ markets, forever. So, in the case of the July-December correction, gold has since dropped 14.5% from its highs while the mining stocks dropped along.
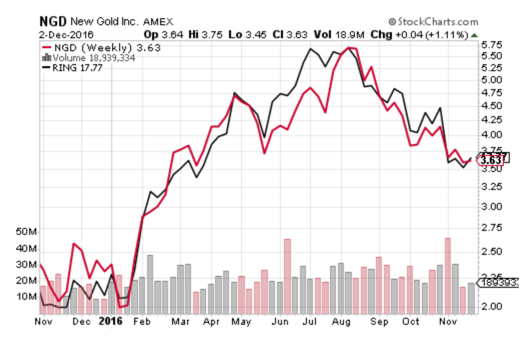
NGD is included among five Exchange Traded Funds (ETFs), MXF, SGDM, ZGD, RING and CNDA. I ran a correlation analysis on these five ETFs against NGD and found no large variances between the five against NGD. So for illustrative purposes, let’s use RING as the ETF to make my point about an anomaly I discovered about NGD in relation to the stock’s brethren in the RING ETF (see chart, below).
You’ll notice that NGD trades very close to RING. But should it? Well, yes, of course, under normal circumstances. But there is a quirk to NGD that nearly all the other ‘gold’ stocks don’t possess. That is, NGD mines produce an inordinate amount of copper as a byproduct of its gold mining operations.
According to the company’s Q3 earning report, New Gold sold 96,452 ounces of gold during Q3 at an average price of $1,328 per ounce, and sold 24.2 million pounds of copper at an average price of 2.17 per pound, for a total of $180.6 million of revenue from these two metals. Aside from a tiny portion of revenue derived from silver sales, no other revenue was a factor in this analysis. In Q3, copper revenue represented 27.6% of total revenue.
Using today’s $1,177 gold price and $2.62 copper price and assume an equal amounts will be sold of each metal in the coming quarters, estimated revenue at the today’s lower gold price and a much higher copper price, calculates to $177.0 million, a measly 1.98% drop from Q3. Under this supposition, the new price levels of gold and copper calculates to copper revenue reaching 35% of total revenue, up from 27.6% for Q3. That’s how much of an impact the copper price has on New Gold’s top line.
In other words, when NGD was trading at $6.00 per share in August during a time of higher gold prices, today’s traders have completely overlooked the effect upon New Gold’s revenue following Trump’s presidential win, as the following nearly-four weeks of trading has benefited NGD no differently from other ‘gold’ miners. Yet, New Gold is really a hybrid gold/copper producer.
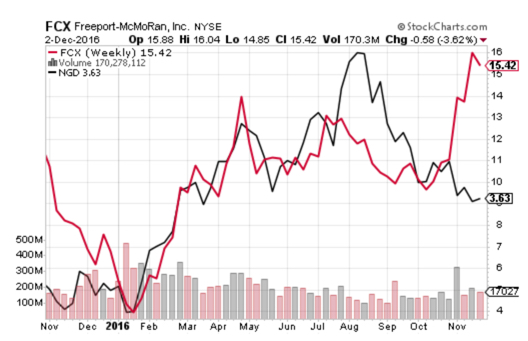
For example, let’s look at Freeport McMoRan (FCX), a major gold and copper hybrid producer, and see how its stock fared during this huge rally in the copper price. The chart, below, shows a soaring FCX price, a 39.55% rise, in fact, during the rally in the copper price.
And notice, too, that NGD dropped following the presidential election along with the other gold stocks. Bottom line: this is an injustice and opportunity to pick u shares at a depressed price of approximately 30%. I estimate NGD should be trading north of $5.00.
I’ll be watching how NGD trades all the way up to the time when the company’s earning release, which is scheduled for late January. This stock may seriously surprise if copper maintains its current price level irrespective of the gold price rallying.
LIVE (LIVE)
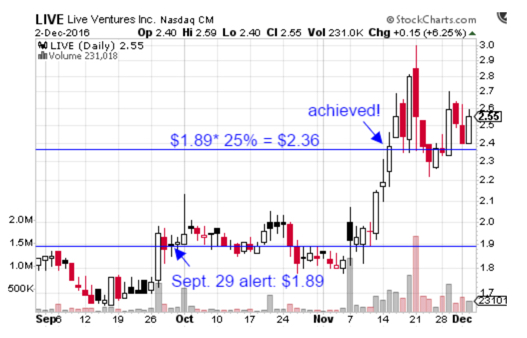
LIVE has not been added to our Watch List again. I’m mentioning LIVE because I want to demonstrate that rumors of me consulting my crystal ball are, indeed, true.
Back on September 27, I wrote a note about LIVE and a list of reasons for considering the stock as a trade. I ended the note with:
The Play:
We anticipate a price spike of +25% the latest in December triggered by the very good financial results. As the price is currently supported by a share repurchase program in the range 1.5 -1.7, the time is ideal to start building up a position.
Well, the chart, below, shows the 25% move and the month in which it attained a 25% move, which was in November. And now we’re into December, and the stock is still rallying. Nailed it!
Congratulations to my readers who took the plunge and made a good score on LIVE.
Until next time…
Trade Green!
Jason Bond


0 Comments