Man was it a rollercoaster this week — over the last 5 trading sessions, the SPDR S&P 500 ETF (SPY) dropped by 9.46%… and we’ve entered bear market territory. Of course, market participants are still scratching their heads and wondering what’s to come.
With all this crazy price action, there are opportunities no matter which side you play the market. Many have panicked and headed for the doors, and I don’t blame them.
However, if you’ve been on the sidelines, I want to show you how I’m still able to hunt down momentum trades.
While there are whipsaws in the market, I’ve found there are a handful of key patterns that have been working for me… and the only thing I need to do is execute properly. Today, I want to walk you through how I was able to lock down nearly 50% on my money in less than an hour.
Repeatable Pattern Snipes Momentum Stock In A Crazy Market
For the most part, my trading involves scalable, repeatable, and easy-to-use chart patterns. Throughout all this market volatility, I’ve been able to uncover some opportunities using a few of my favorite setups. For example, the bull flag pattern.
I know what you’re wondering, “Jason, isn’t that a bullish setup? Why in the world would you want to use that when stocks are entering bear market territory?”
Well, there is a time and a place for the patterns I use. You see, right now, I’m looking for short-term trades. It also helps to find stocks that aren’t necessarily moving with the overall market, or are relatively stronger than the S&P 500.
Let me show you what I mean by that.
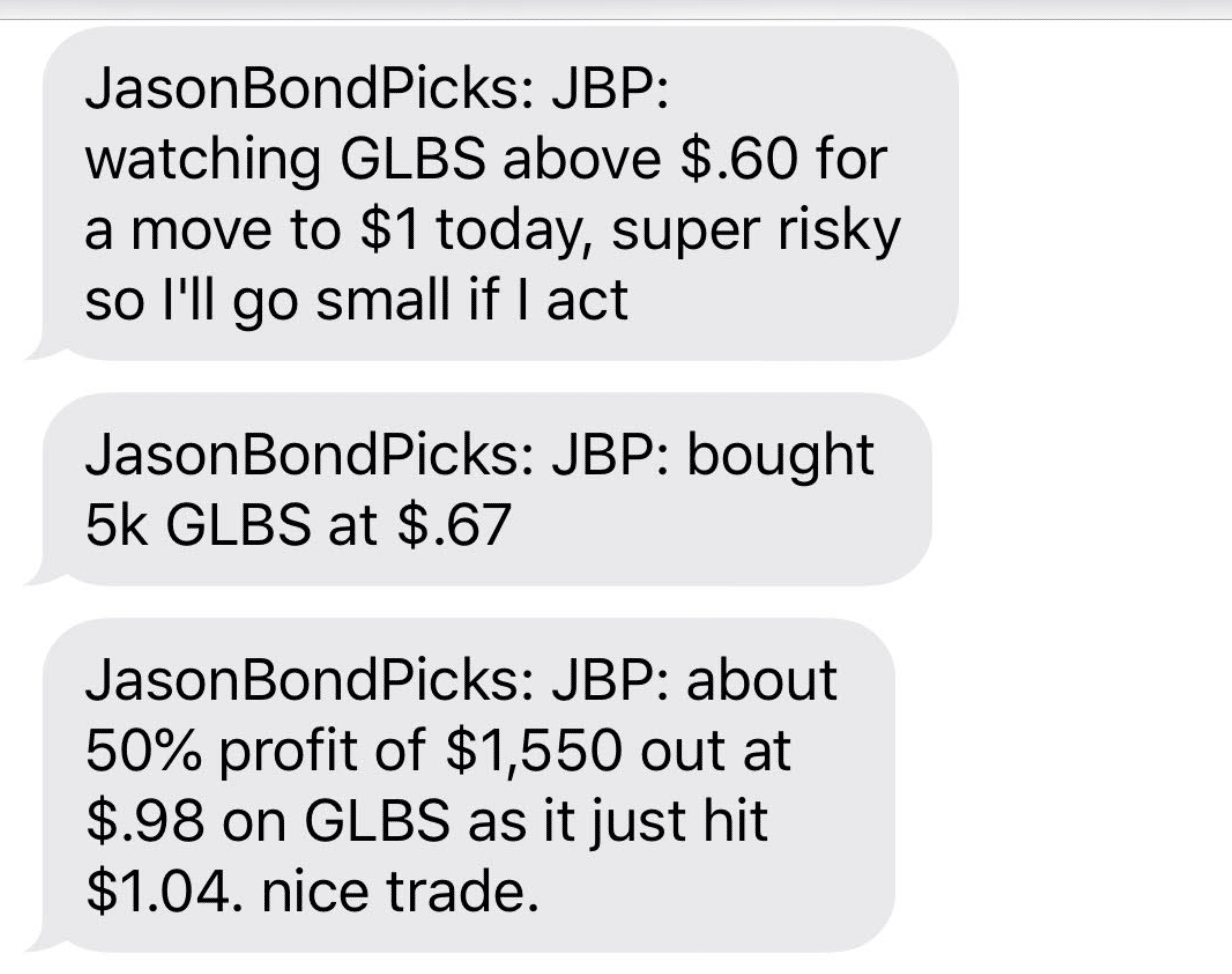
On Friday, I alerted Jason Bond Picks clients and let them know that Globus Maritime (GLBS) was on my radar.
Why?
The stock had a strong move right out of the gate, and I figured it could move significantly higher based on the chart pattern I was watching. However, since the stock was pretty volatile, I decided to take things easy and trade with a smaller than usual position size.
So what was the exact pattern in GLBS?
The bull flag pattern.
Bull Flag Pattern Spots $1,550 Winner In Less Than An Hour
So what’s the bull flag pattern?
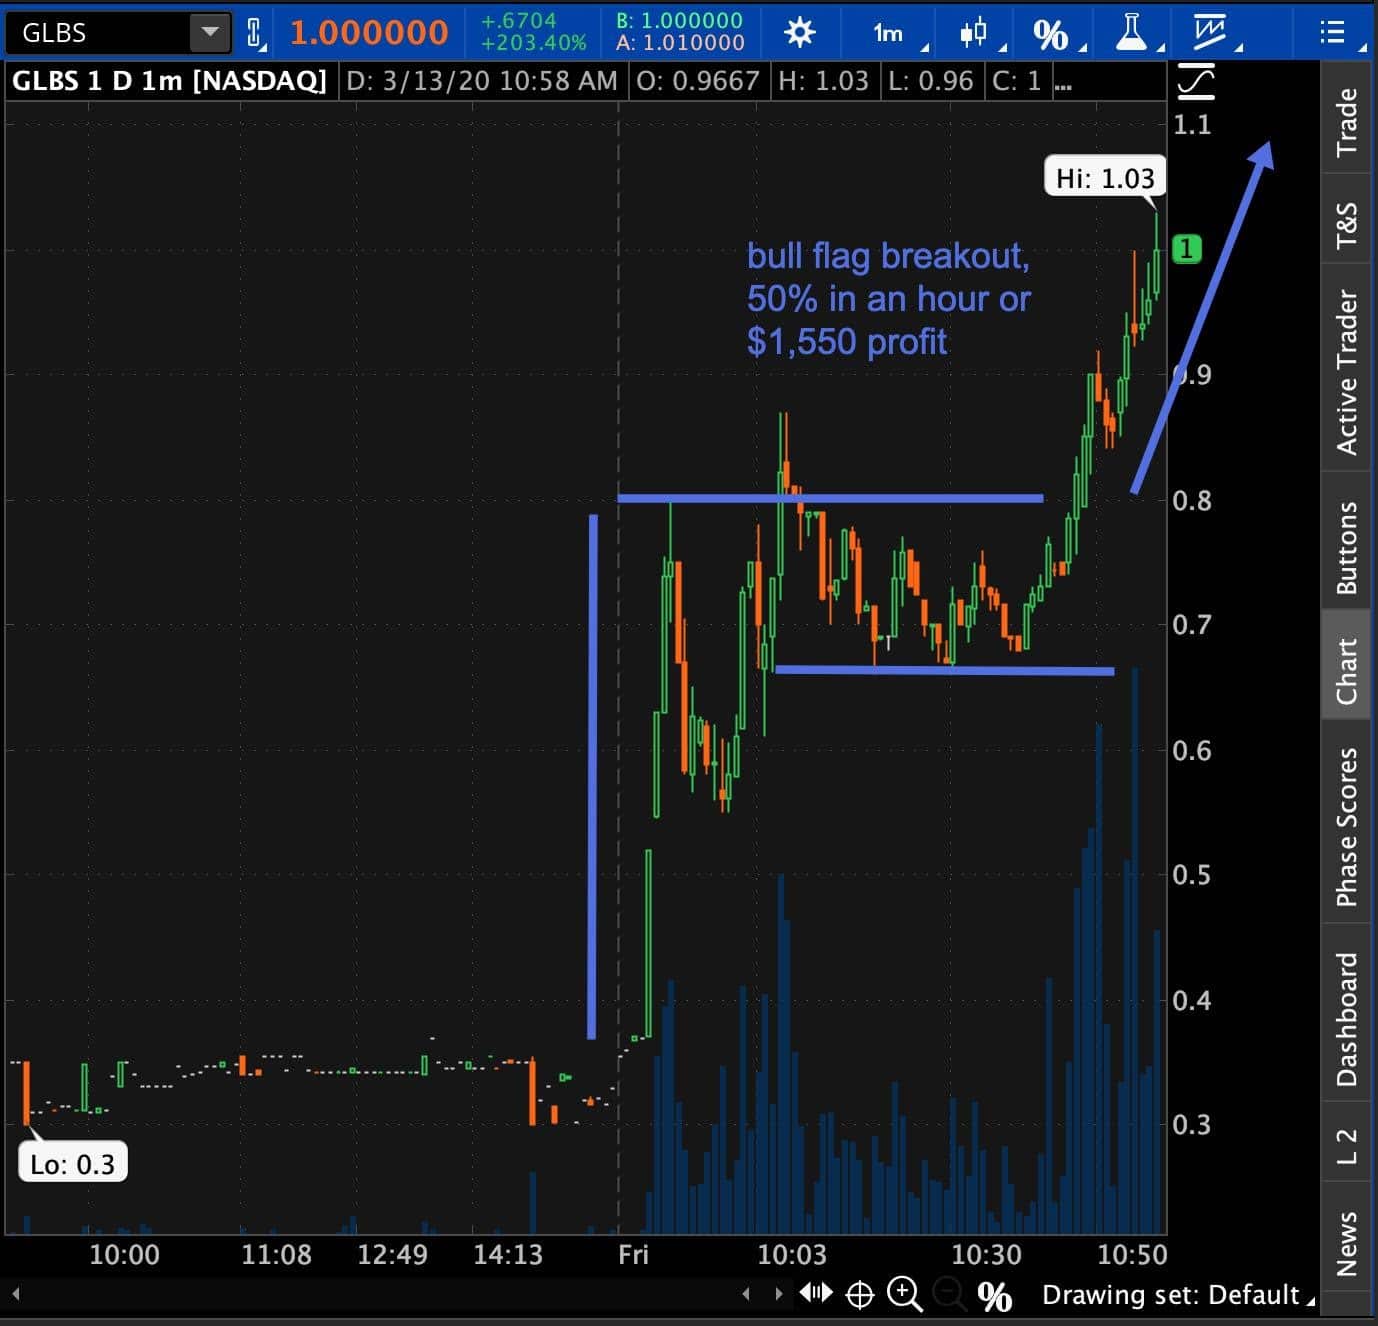
Here’s a look at the exact setup I traded.

https://jasonbondtraining.com/masterclass/
If you look at the chart above, GLBS formed a textbook bull flag breakout. First, you’ll notice the stock exploded higher from just under 40 cents. That’s where the flagpole is formed. That step is crucial to the bull flag formation.
The next part of the bull flag is the consolidation — the flag part of the pattern. This is the area in which I find value and want to buy shares.
Why?
I find there is a high probability that the stock could break out of the consolidation area. While many traders like to wait for confirmation of a breakout, I find the risk-reward doesn’t satisfy my wants.
With this specific setup, I let my clients know about my moves and why it was a risky setup.

https://jasonbondtraining.com/masterclass/
Why?
Well, if the stock actually broke below the consolidation area, it could fall fast. So I actually planned my trade accordingly.
So what did I do?
I purchased 5,000 shares at $0.67… right in the consolidation area (the flag portion of the pattern). Of course, I figured the stock could build momentum and get to $1. As you can see from the alerts and the chart pattern… the stock made its move and I took profits at $0.98.
That was good for a 46.27% winner in less than an hour, or $1,550 in real-money profits.
So what’s the key takeaway?
- The bull flag pattern could be useful on any timeframe chart.
- The “rest” phase has the potential to offer high risk-reward opportunities.
- Bull flag patterns could be useful to spot momentum breakout trades.

Looks great