Even if you’re a relatively new trader, I think you’ve heard these words by now…
Not a minute passes on fin-Twitter without a guy calling for one, and another bragging about how far a stock can get to if the demand picks up.
They all have a point, in my opinion: short squeezes can cause quick and violent moves – for some traders, this is their bread-and-butter… for others, they get pummeled and take a lot of pain as they bet against the stock.
The best part of it?
For me personally, they’re purely technical and I don’t always need to look at the fundamentals, but if there’s a catalyst… it’s even better for a short squeeze play.
That said, I believe learning how to spot one can be an extremely powerful tool in your arsenal.
In a minute I’ll show you exactly how it’s done, but first, let’s start with the basics.
What Is a Short Squeeze?
When a trader goes long a stock, the absolute worst thing that can happen is price goes to 0.
On the short side, however, there’s a risk of a stock more than doubling above the entry and putting the trader’s position value to below 0.
In other words, it’s possible to lose more than you put in.
It’s market dynamics because they don’t own the security. They actually have to borrow from the broker to short a stock. It’s a little complex behind the scenes when it comes to short-selling, and I think your broker can educate you if you want to find out more.
Needless to say, I don’t think anyone wants to short a stock and wake up to losing more money that they put in a trade.
When a short position gets near that level – many traders would cover. When a position is above it – a broker will force cover for them, to protect its own books.
If enough short traders are in a bad spot at once, such forced covering will cause an explosive increase in demand for the stock and as a result – a sharp move higher.
The initial move in turn forces even more shorts to cover creating a snowball effect, which culminates in a quick and parabolic squeeze.
How Does it Happen And Look?
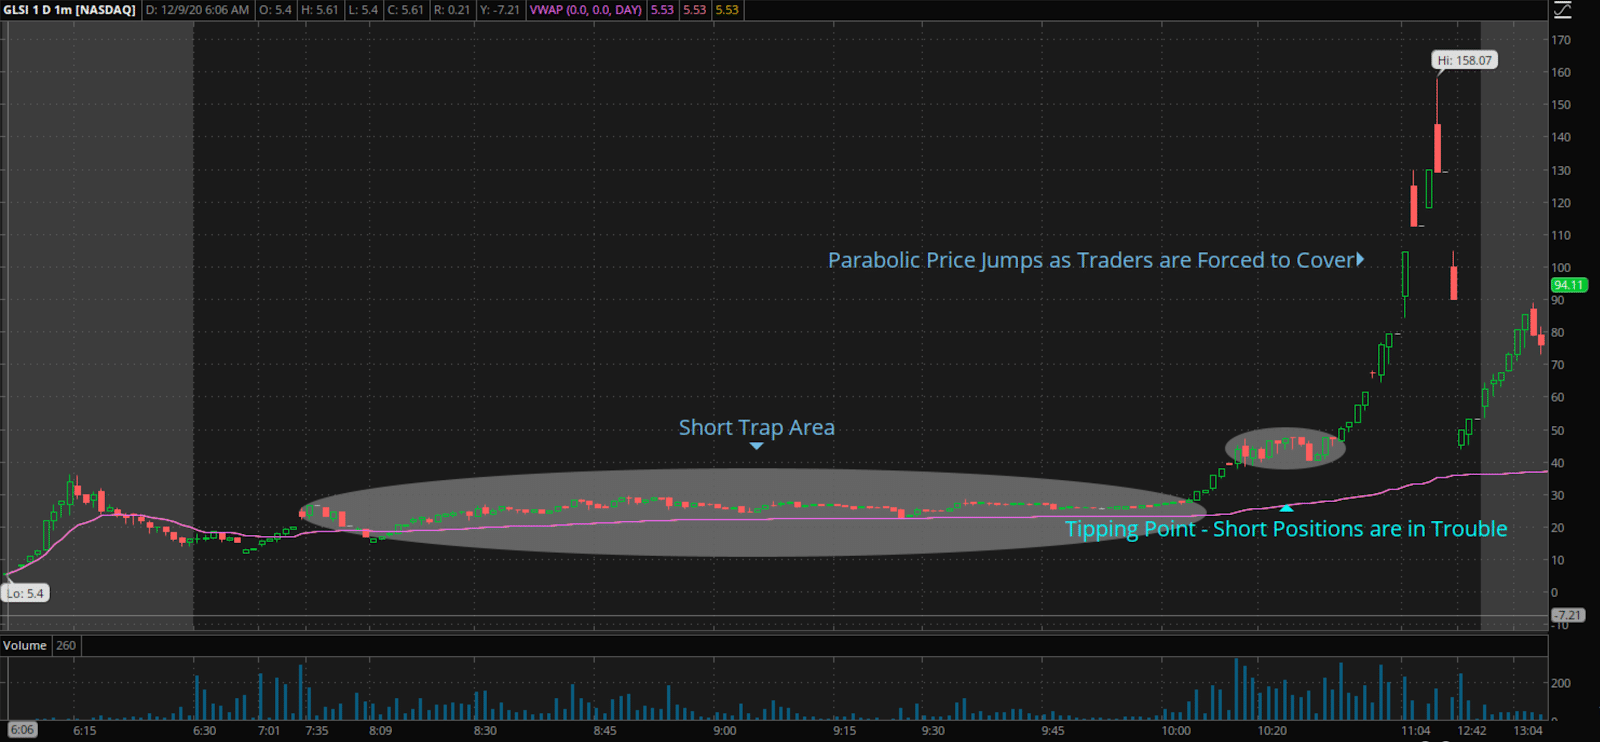
From a Technical standpoint, there are 3 main parts to a squeeze, in my opinion:
- Short Trap
Trap is an area where traders actively enter short, betting that the price will drop.
The more short positions there are – the bigger is the number of shares that would have to be bought back should the stock price come to the tipping point.
- Tipping Point
A price area where a lot of short positions are either close to negative or negative already.
Any further uptick will cause a wave of forced covering.
- Parabolic Squeeze
The end game of it all. Forced covering that’s forcing even more covering and not letting go of the buy button until every stubborn short trader is squeezed out.
Here’s an example of an intraday short squeeze in GLSI:

Short squeezes don’t have to be intraday, some last years:
I mean take a look at TSLA. If you pull up the long-term chart, that stock has been parabolic, despite short sellers attacking the company.
How Do You Spot and Trade One?
I know that’s probably the question on your mind right now.
As I explained above, short squeezes are the result of 2 key factors: too many short bets and the price of a stock above their entry.
One major factor to keep in mind is the short interest. Typically, if a stock has a short interest above 20%, traders will say it’s heavily-shorted.
Now, another factor to look at is the float. The float gives me an idea of how many shares are available to trade. So the way some traders think about it is if there’s a high short interest coupled with a low float…
There can be a situation in which there’s heavy demand for the stock. If the stock runs higher, those who are short may be forced to cover as those who loaned the shares out may ask their broker to call them back.
It becomes a vicious cycle, and tomorrow, I’ll show you how to scan for stocks with high short interest.

Great info, Jason.
is there a list of scanner presets you use for the different stocks? like a cheat sheet? thanks man keep up the great work! stay frosty