There was one interesting question I kept noticing, and it’s a topic I believe can help traders generate trade ideas.
Traders were asking, “What’s a sympathy play?”
As a momentum trader, I believe it’s important to understand sympathy plays. You see, if one stock explodes, it wouldn’t be crazy to see its peers run with it.
Why?
Traders miss out on large moves all the time. Rather than chasing, they look to an alternative to play the move… they look at their competitors and will look to buy those. In other words, the competitors move in sympathy to the leader.
To be honest with you, sometimes my best ideas are sympathy plays.
If you’re able to spot sympathy plays early, I believe it can be powerful.
That’s why I want to draw back the curtains and reveal to you some techniques to uncover these plays.
How To Uncover Sympathy Plays
Sympathy play is just an easier way of saying, “This stock is likely to move in tandem with the leader in the pack.”
The key is to find the laggards and look for a recognizable chart pattern that may signal it can move.
For example, take a look at Tesla Inc. (TSLA), it’s a clear leader in the auto manufacturer space. Of course, there are other electric vehicle companies out there, and there will be traders who can’t stomach the volatility TSLA provides.
So what do they do instead?
They look for the next best thing, their peers and competitors.
There are tools to uncover that information pretty easily.
For example, if you go on Finviz and search for TSLA, you can click on its industry, and you’ll see something like this.
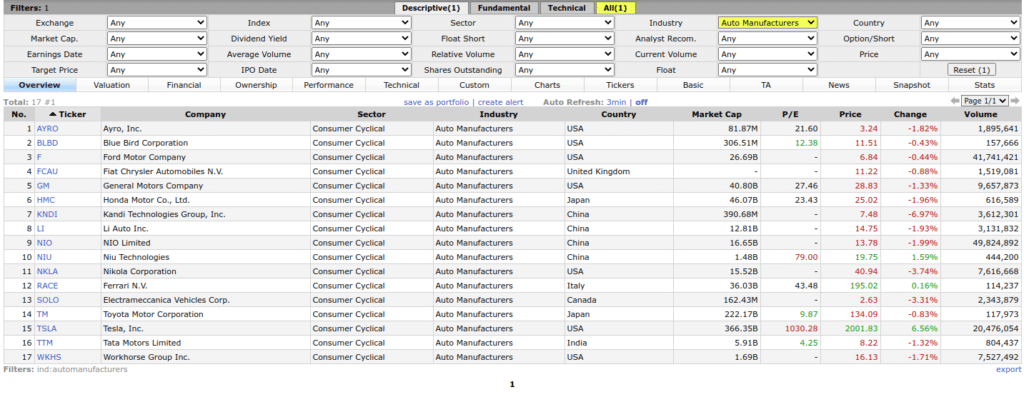
You can filter this down further by other factors, such as price, performance, short interest, average volume, etc. However, for now, let’s just focus on how to find potential sympathy plays to trade.
What I would do next is change to the Charts view.
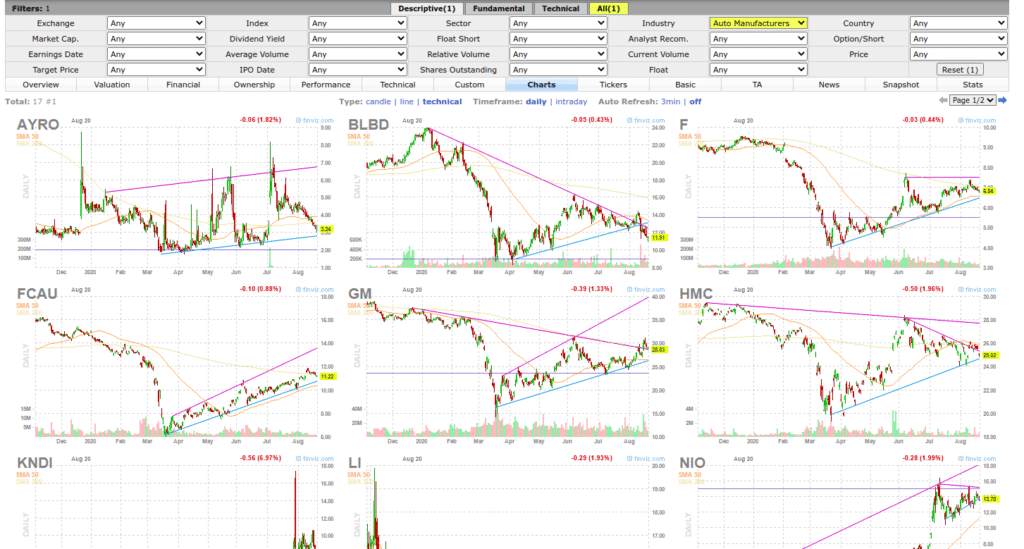
I’ll be able to scan for my favorite chart patterns, then I’ll throw it on my watchlist.
I’m able to recognize my favorite patterns quickly because they’re easy to spot for me. So here’s a look at three trade ideas I found.
Workhorse Group Inc (WKHS)
Check out the daily chart in WKHS.
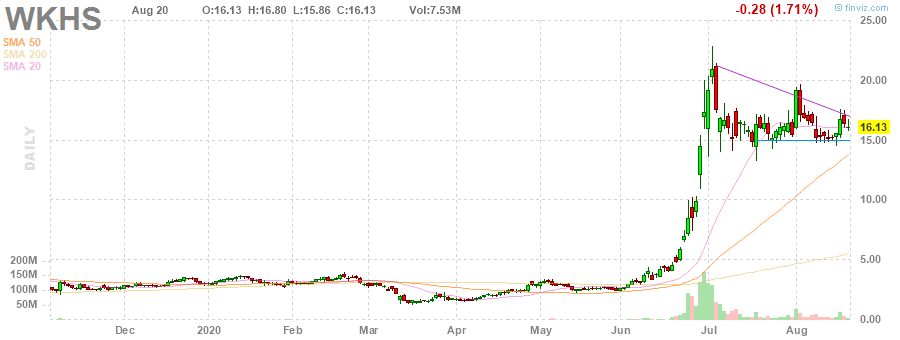
This is the bull flag / pennant pattern and its found support right around the $15 level. Right now, the stock looks pretty interesting as a sympathy play for the massive run higher in TSLA.
Additionally, WKHS has a short interest greater than 20%, so if there’s a positive catalyst or the stock starts to run higher… I wouldn’t be surprised if WKHS makes a large run and causes a short squeeze.
NIO Limited (NIO)
Next up, there’s NIO.
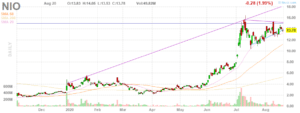
This is what some like to call The Tesla of China. NIO has an ascending triangle pattern forming, and it’s been on an uptrend. If TSLA continues its run, I wouldn’t be surprised if NIO follows suit and breaks out.
Last, but not least…
There’s Kandi Technologies (KNDI)
Kandi Technologies Inc (KNDI)
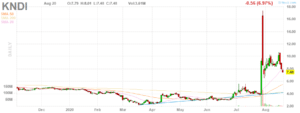
If you look at the daily chart in KNDI, it’s actually suffered a pullback. The pattern I would use here is the Fibonacci retracement. KNDI is pulling into a key support and Fibonacci level right around $6.50.
If the stock holds there, I think the demand for the stock can pick up, and it might make another run to $10.
If you can spot chart patterns, I think you can start to get quicker at generating trade ideas.
That’s why I created this training workshop on my favorite chart patterns.
You’ll learn some of the techniques I utilize to hunt momentum stocks before they run, and how I’m able to trade on a part-time schedule.
Normally, this would cost $300, but you can attend for absolutely free.
All you have to do is register here.

0 Comments