Despite the market rebounding last week after a 3-day rally, traders are still in a daze as they try to figure out the true impact of the coronavirus. The U.S. has now topped 100,000 coronavirus cases, and many of us are quarantined at home.
Now, I know many people are bored and want to step their game up — so in order to help as many people out as possible, I opened up a discussion with my readers… responses poured in and many of you asked: how do I find stocks to trade?
In this market environment, I believe that location is key. In other words, knowing where to look for momentum trading opportunities. For the most part, I’ve found success in small- and mid-caps.
Today, I want to walk you through exactly how I filter down thousands of stocks out there down to just a handful — as well as one key pattern I’m using to hunt momentum stocks in this environment.
[Exposed] My Method To Hunt Down Momentum Stocks In This Market Environment
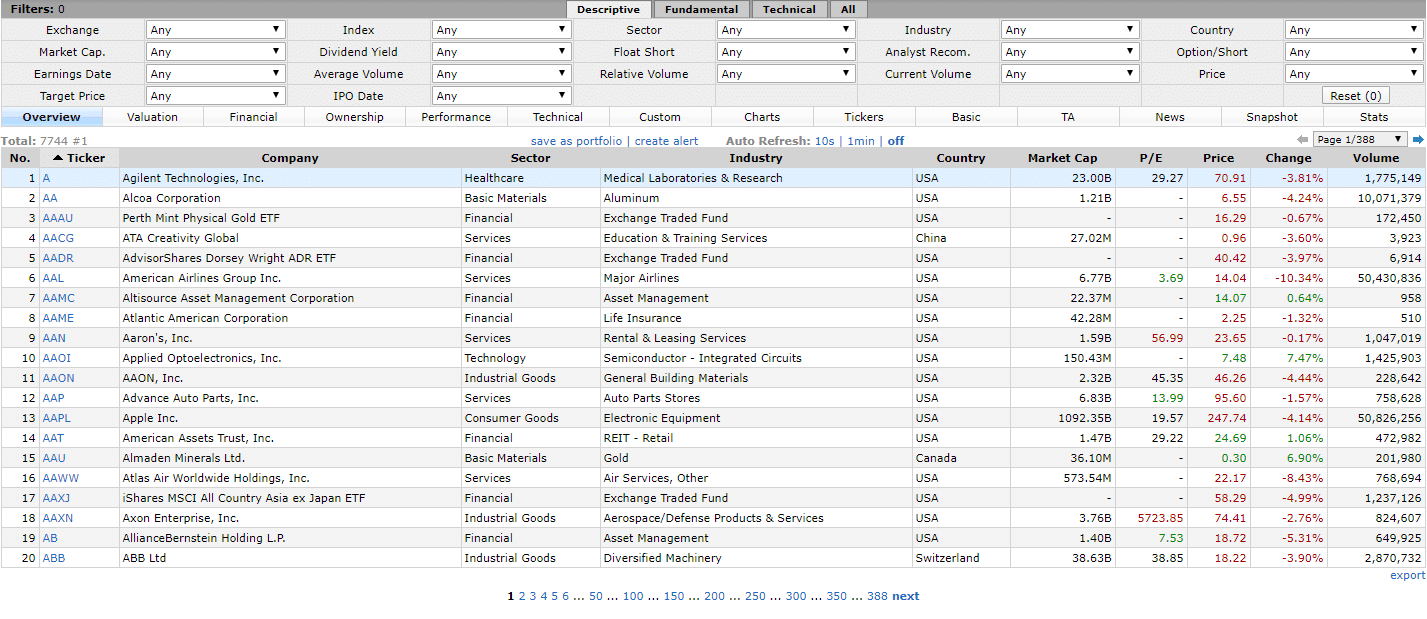
If you just go to Finviz and hit the “Screener” tab, you’ll notice there are more than 7,500 stocks for us to trade!
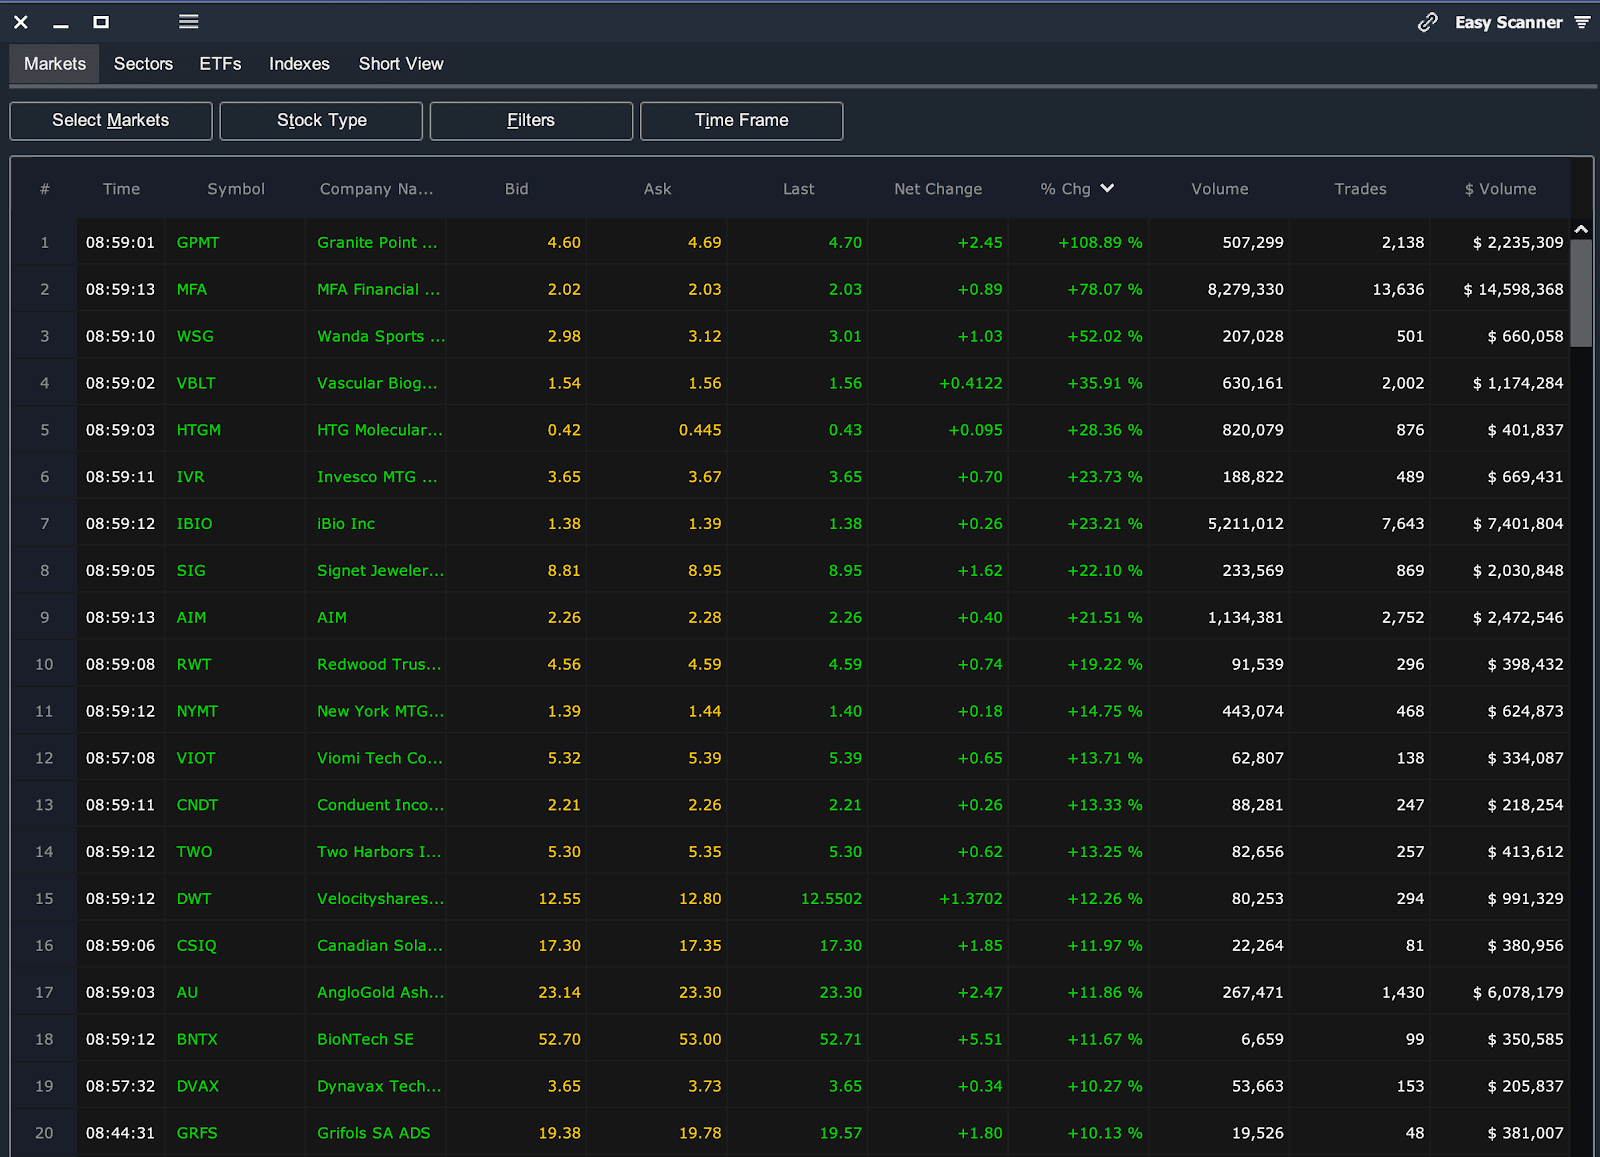
Of course, it could be overwhelming at first… but there are a few things you could use to narrow down your stock trading universe. For me personally, I like to keep things simple by scanning for stocks with just a few specific criteria:
- Market Capitalization. I only want to trade small- and mid-cap stocks (that means stocks that have a market value anywhere between $300M to $10B)
- $ Volume. I like to look for stocks with a lot of volume, in terms of the dollar value traded that day.
- Percentage Change on the day. Depending on which chart pattern I’m using, I may want to rank stocks based on gainers or losers on the day.
To keep things simple, I look for stocks that are under $30 and have at least $2M in liquidity near the open of the market.
Pretty easy, right?
My scanner only lets me know which stocks are moving on the day… but it’s up to me to figure out which ones have the highest probability of success. In order to figure out which stocks are poised to explode, I rank my filter based on percentage change… then I look at the charts of the top 10.
Let me show you how it all works.
One Key Pattern I’m Using To Find Winners Right Now
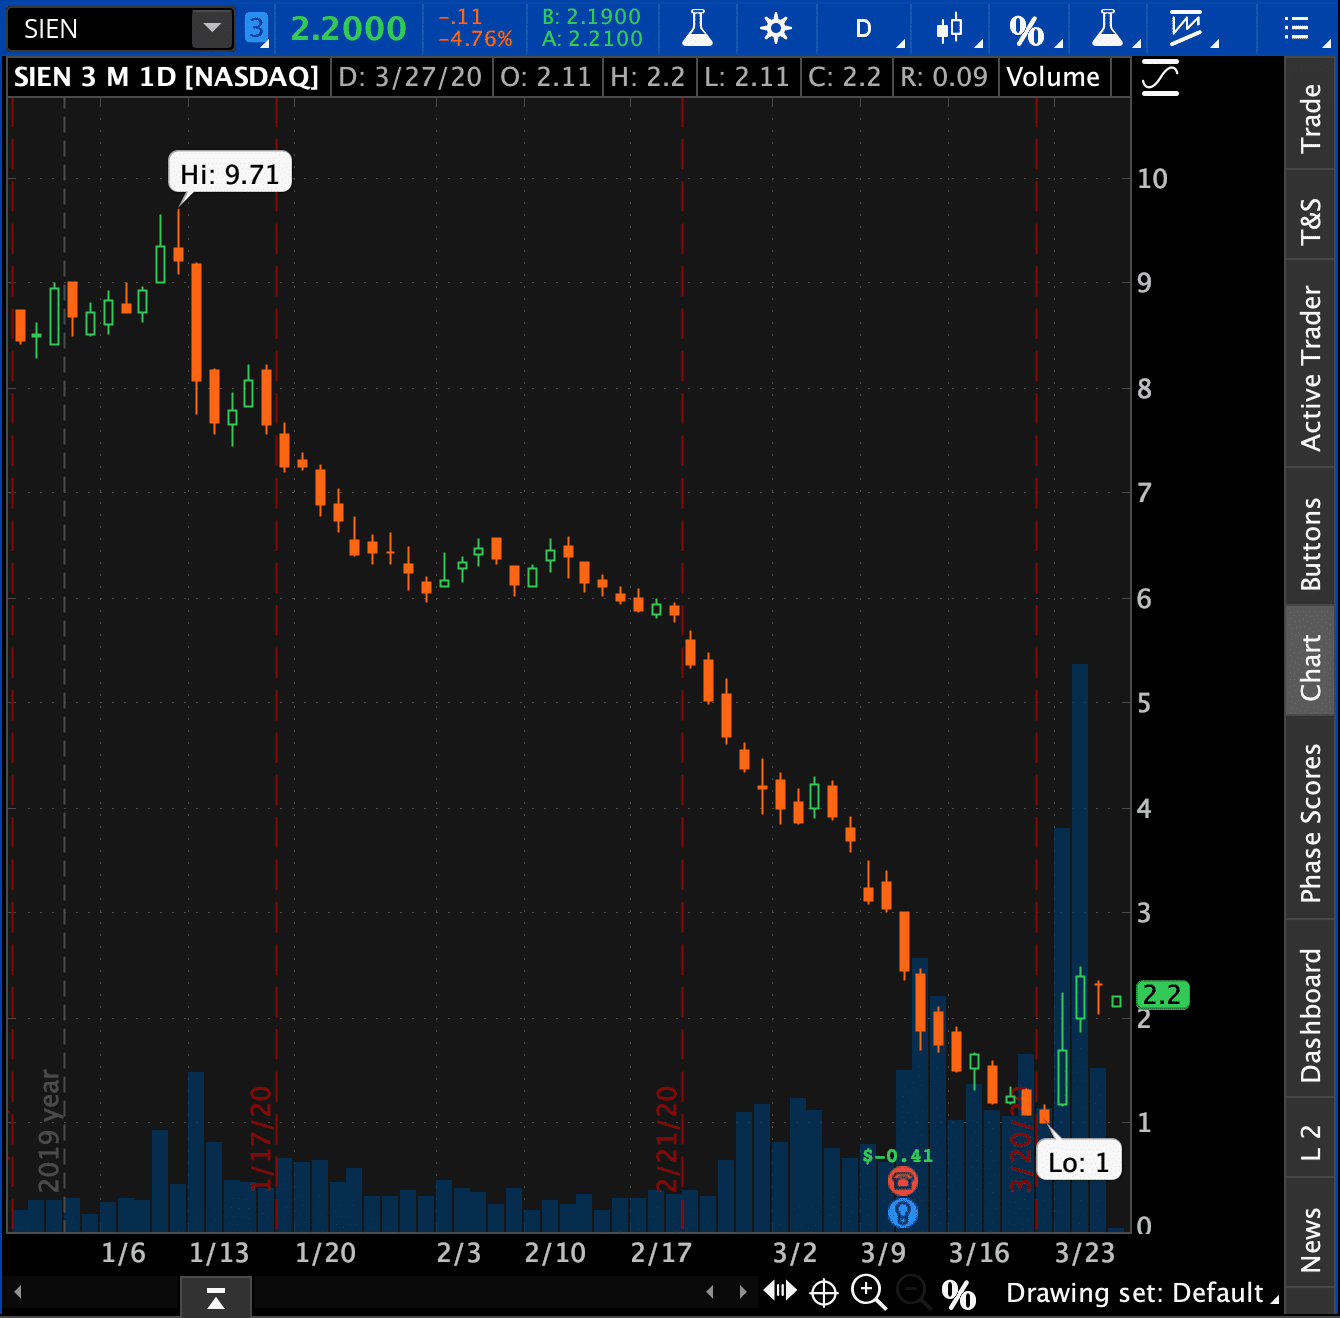
The “higher low bounce” is one pattern I’ve kept my eye on in this market environment. Basically, it’s my trusty fish hook pattern that actually materialized… settles for a day or two… then continues higher.
I’ve found the the range is less on the subsequent continuation of the bounce. However, the stop loss is fairly identifiable still and the continuation fairly predictable, assuming the markets trades sideways or higher.
This allows me to properly plan my trades.
I saw this setup in SIEN.

I want you to get into the habit of spotting these patterns on your own, but if you look at the chart in SIEN above… it looks like a fish hook, right?
I spotted a similar pattern in CHEF recently, which was good for a 30% winner. Now, with SIEN, I sent out an “advanced notice” alert to my clients…
From today’s watch list. This is the ideal pattern of bounce, rest and bounce again. See TLRY chart a few days ago for example. OSTK is the same pattern, I’m watching that closely too. $2 is the pivot here so I’m looking to buy above that level, stop below. 10-20% profit goal.
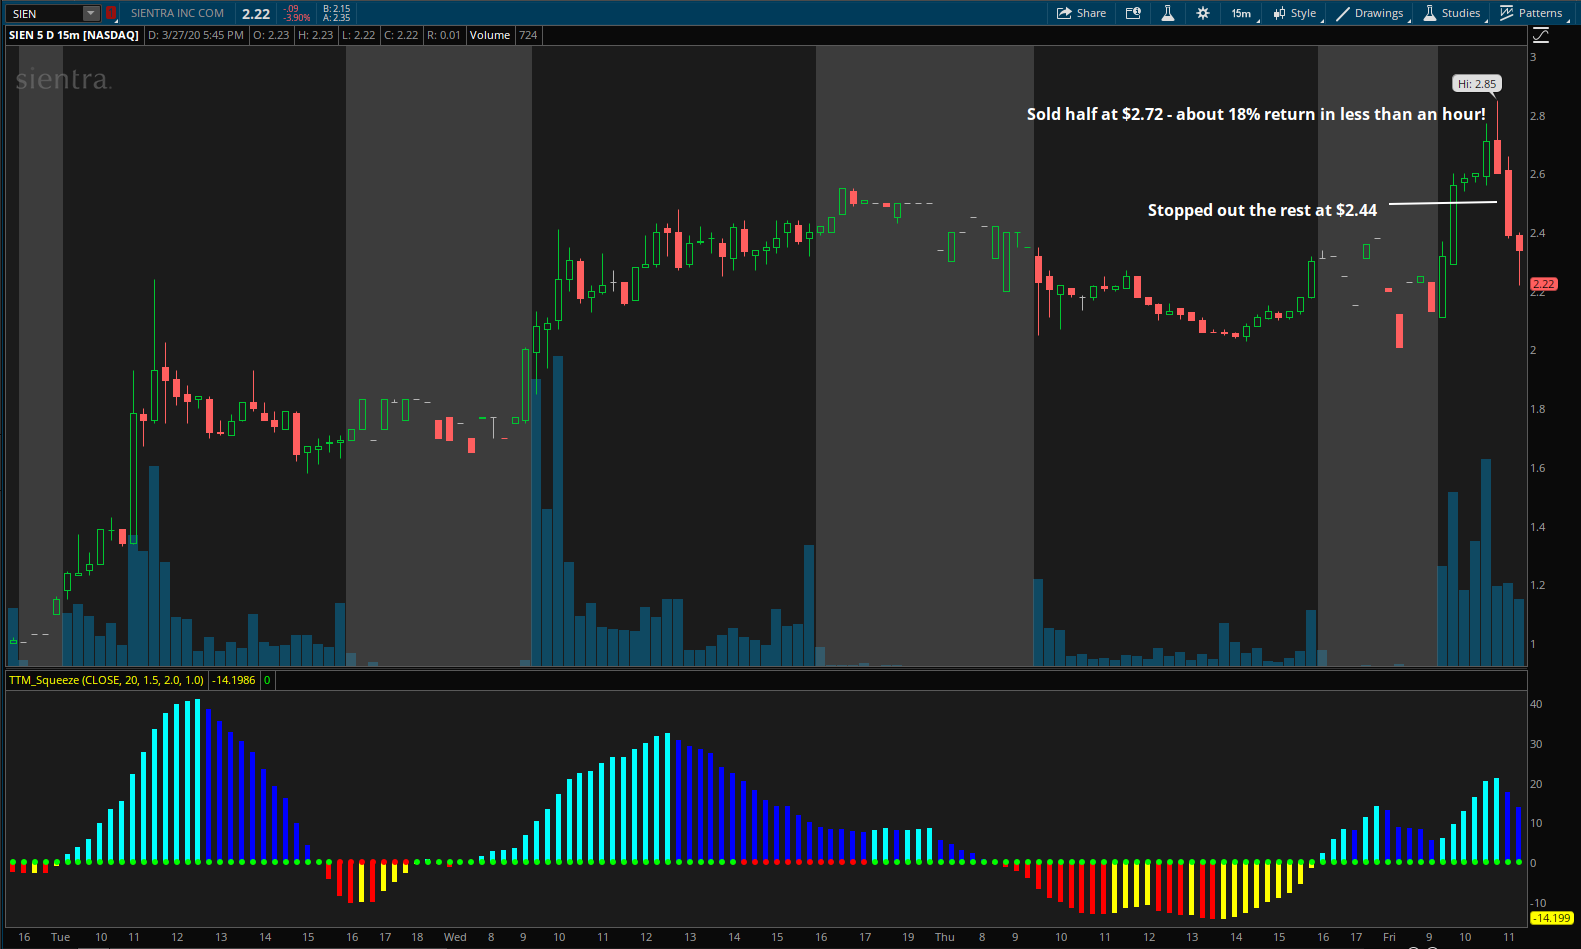
This let my clients know I was looking to get into SIEN… and 11 minutes after, I bought shares of SIEN at $2.33 and planned to take profits around 5-10% higher.
Guess what happened with SIEN?
The stock broke above my target, and I was able to sell half of my position at $2.72! That was good for about $2,000 or 18%. As you can see, SIEN actually pulled back, but I had a profit stop on, so I sold my remaining shares at $2.44. In total, I was able to lock in $2,500 on the trade.
If you’re struggling to find stocks to trade in this environment, I want to show you that it’s not as difficult as you may think… and it’s as simple as just scanning for stocks and looking at two key patterns.


0 Comments