The markets got hammered, as we witnessed the worst selloff since 2008. Of course, it’s been tough out there for many — that’s why I decided to open up a discussion with my readers to see where I could help.
I received an overwhelming response, and one question I kept seeing in my inbox was: How do I find trades in this market environment?
The problem that many traders have with uncovering opportunities in the market could be due to two reasons.
1. They don’t know where to look.
2. They’re ill-prepared and don’t know where to enter, stop out, or take profits. In other words, they don’t have a plan.
Which is why I sent Bond’s Beat to you the other day, it details exactly how I alert my clients about my trades. More importantly, I revealed one of my bread and butter setups, and how I locked in a near-50% winner.
I wanted to follow up and prove to you that sometimes, all you need to do is look in the right areas in this market environment — it’s also crucial to have a few scalable and repeatable patterns in your tool kit.
In order to provide the most value, I want to walk you through a real-money case study and reveal to you how I spotted a near-40% move in BLPH. More importantly, I will show you how you could’ve taken part in the action.
[Revealed] How I Spotted A 40%+ Move In BLPH
Bellerophon Therapeutics Inc. (BLPH) was one of the hottest stocks on the market yesterday. BLPH closed at $3.39 and hit a high of $26 (a whopping 667% at one point). The reason for the move: the FDA granted emergency expanded access for INOpulse to treat the coronavirus.
Once I saw the breakout on the news, I knew I had to keep my eye on it. Not only that, but the stock had heavy volume, as it traded more than $100M in volume in the morning session.
Sometimes, all you have to do is look at the top gainers or top volume stocks to find opportunities in this market environment. That’s exactly what I did in BLPH.
However, I wasn’t just going to buy the stock blindly. I needed to have a reason to get into the trade. Moreover, I needed a clear-cut plan, so I looked to the charts.
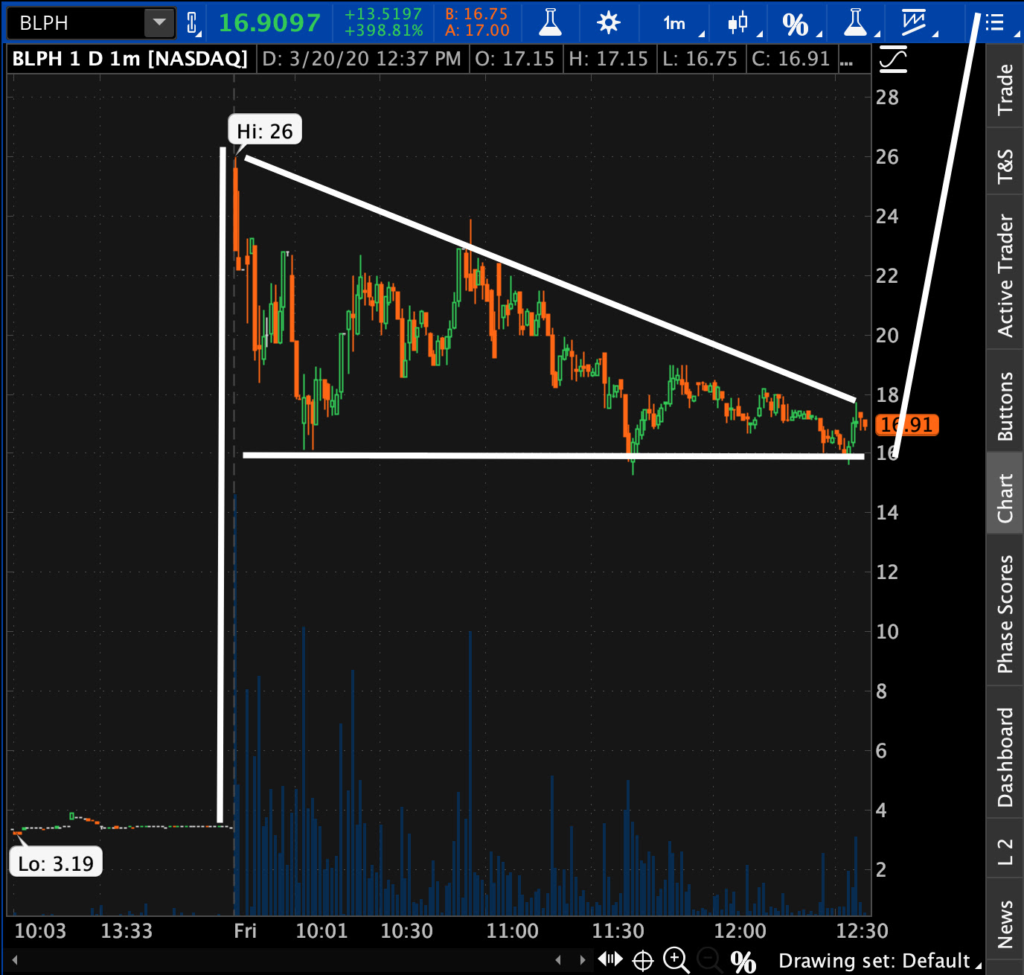
I noticed one of my favorite setups — the bull pennant/flag.
In this environment, it helps to look for intraday bull flag setups because you could spot massive breakout opportunities in just a matter of hours, sometimes minutes.
Here’s what I’m talking about when I mention a bull flag setup.
The “flag pole” represents the initial move (in BLPH’s case it was a massive gap up from $3.39 to $20+, as shown in the chart above). The “flag” (the triangle) is what I call the resting phase.
When I spot this, it usually means the stock is going to continue in the direction it’s going once it forms the pattern.
Pretty simple, right?
The next step was to identify my entry, stop-loss, and target.
How To Find The “Perfect” Entry
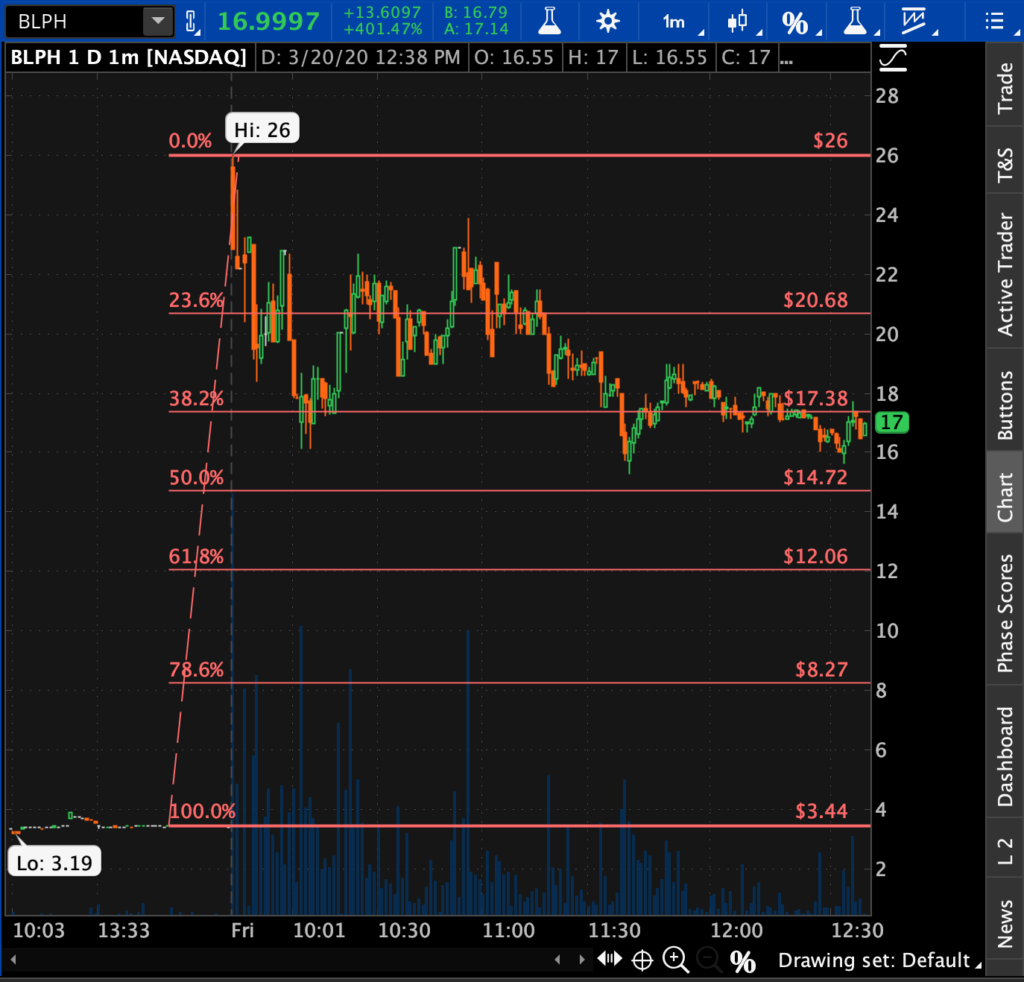
With this specific trade, to improve my odds of success, I looked at another pattern. When stocks explode like BLPH did, I find it’s helpful to use the Fibonacci Retracement tool.
Basically, this lets me know of potential entry points (typically, it’s around the 50% or 61.8% retracement levels).
Here’s a look at what I’m talking about…
If you notice, BLPH tested the 50% retracement level twice, and couldn’t break below it. That’s an indication it could act as a support level.
So I planned ahead and looked to enter around $14.72. However, it was early in the trading day, so I wanted to remain patient and see if this wants to come into $12, the 61.8% retracement.
I figured if the 50% held into the afternoon, that would be the level I would’ve tried to get in, if it’s 61.8% a bit later, that’s the level.
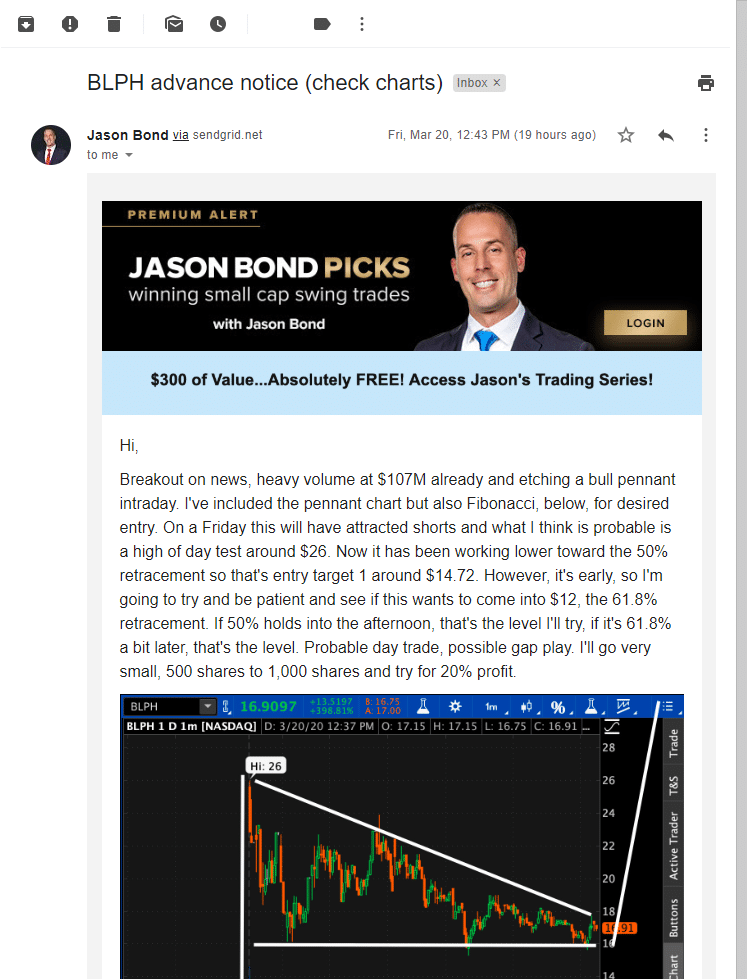
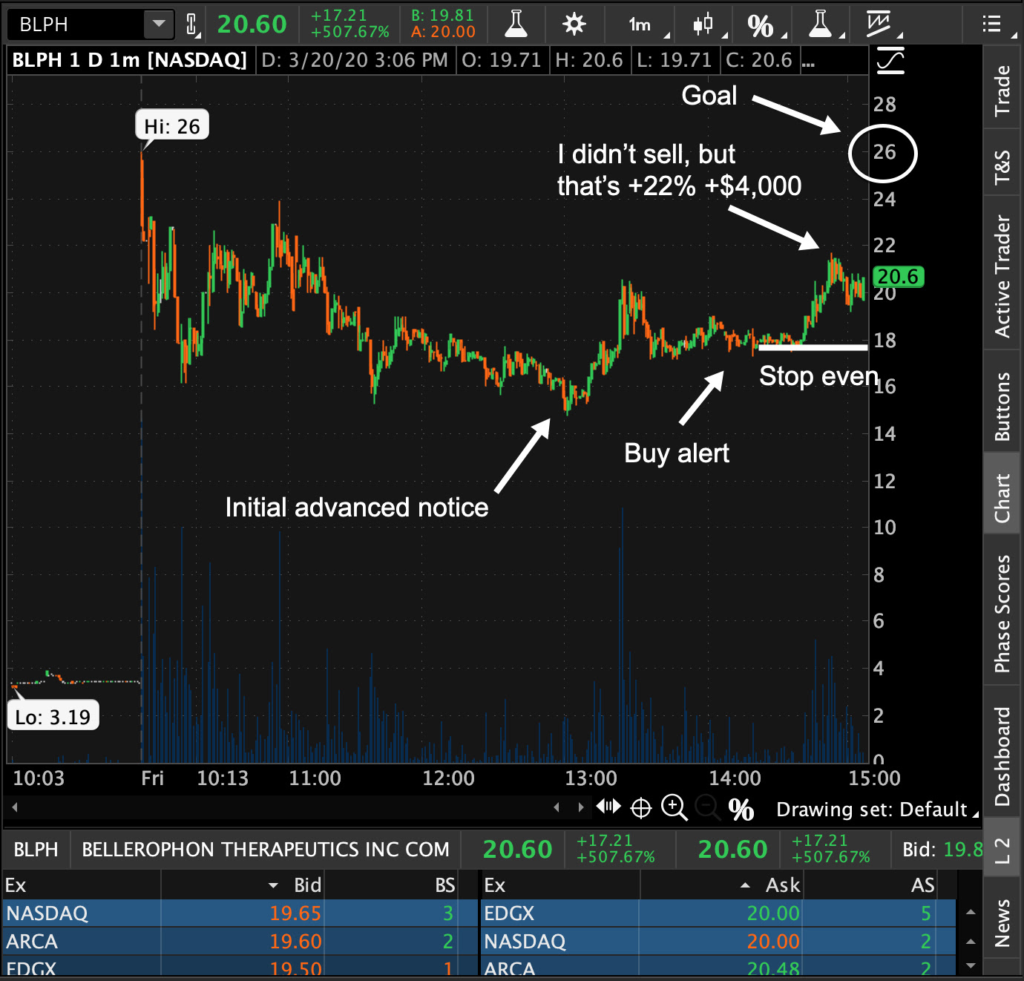
After I found the play, I let my clients know about my idea AHEAD of time.
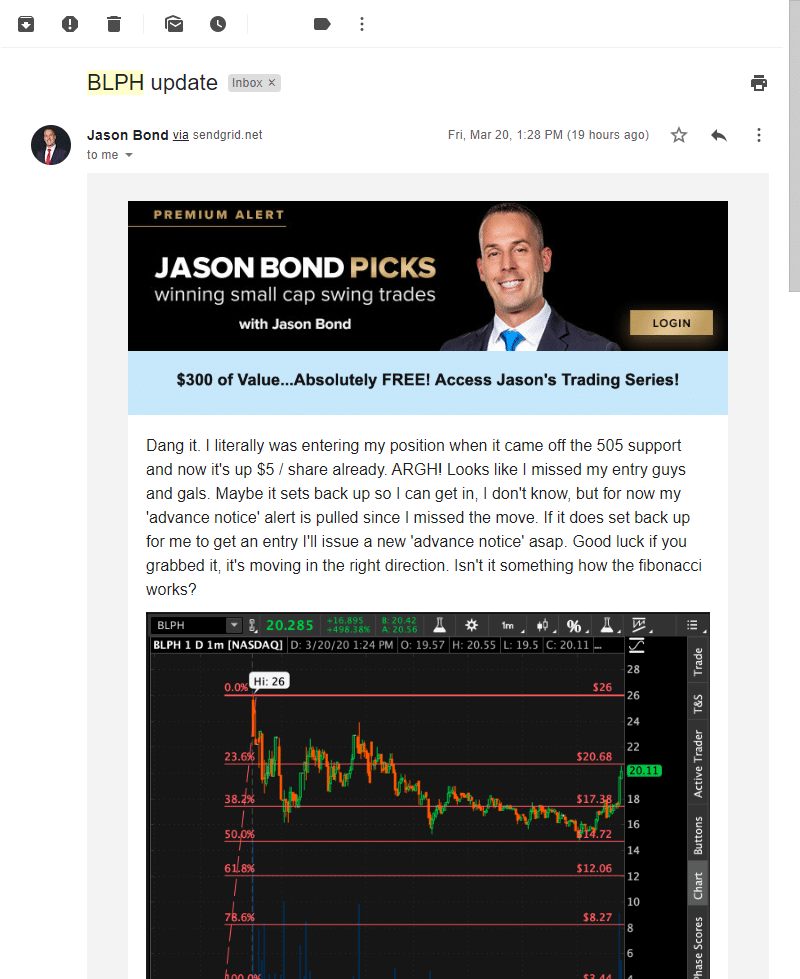
Heck I even updated them about the trade…
I’m bummed out that I missed out on the entry. However, I was watching BLPH closely, and it came into a level that I liked (right around the 38.2% retracement, which could act as a support level).
I was able to scoop up 1,000 shares at $17.91, and I was monitoring the $16 level for my stop loss. My target was in the middle $20s to take profits. The thing is, I went for glory and didn’t take profits… and I broke even on the trade.
However, it was a different story for some of my clients…
Many of them were able to nail the trade because they stuck to the plan and took profits off the table. As you can see, in this market environment, there are simple ways to find trade setups… and you don’t really need to be at your desk all day to find them.
If you want to learn how to make money in the current market, I want to give you my blueprint on how to make it as a part time trader. Click here for all the details.



0 Comments