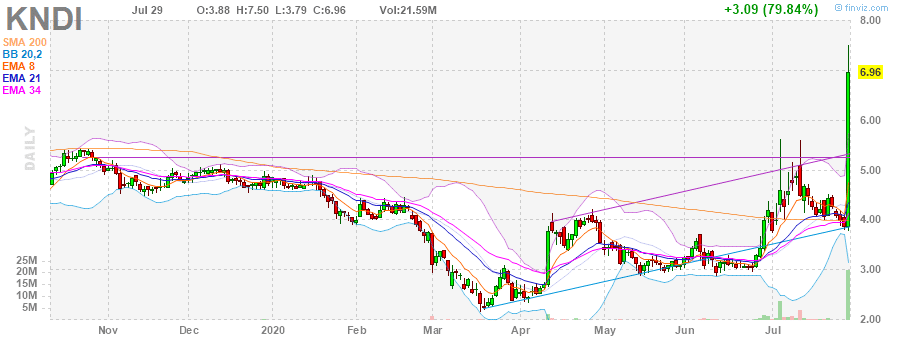
At one point this week, Kandi Technologies (KNDI) was up more than 300% over a two-day span.
The stock moved from about $4 to more than $17, after the company announced it would launch electric vehicles in the U.S.
You better believe there was a lot of FOMO.
Robinhood traders ate that news up…

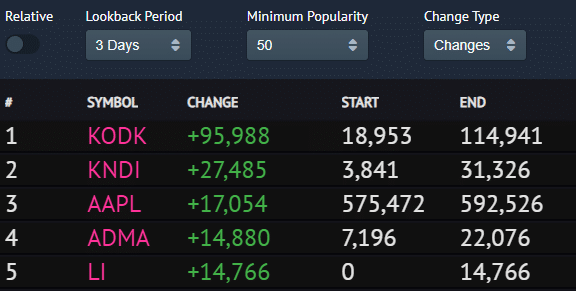
KNDI was the second-most added stock over the last three days.
But the reality is, a lot of these traders chased the momentum and got burned.
The stock suffered a large drop after making that massive move, and that’s just the way it goes with momentum stocks.
However, I believe traders could’ve actually spotted that move ahead of time… and got out before KNDI pulled back.
How?
The Pattern That Uncovered The Move In KNDI
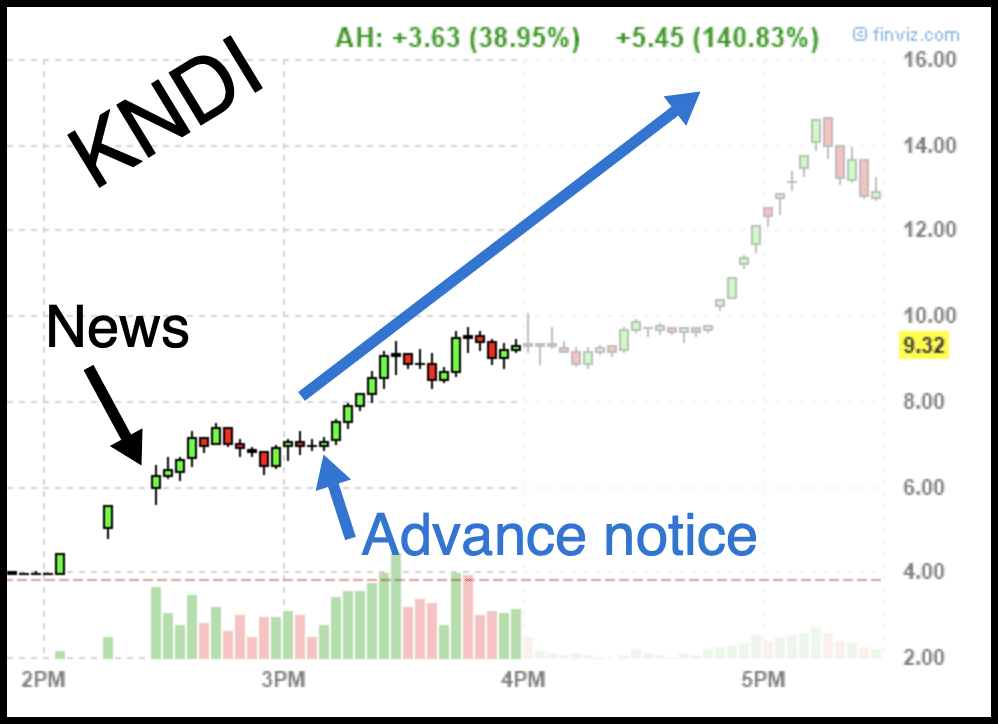
Here’s what I sent out in an advance notice alert on Wednesday.
KNDI had big news today and has had a clear breakout above the $5’s resistance. $6.20’s is acting as afternoon bull flag support and I suspect if that holds up, a possible gap to round number $10 could be in the cards here. Goal is 10-20% within that possible range. Stop loss is below $6.20’s for me, most likely.

The reason?
There was major demand for the stock after it broke above the $5 level.
On the intraday chart, there was a bull flag pattern. Typically, when I notice that patterns, stocks can break out and pop. More on that later.
I want to teach you the process that I used to find KNDI and alert it to subscribers.
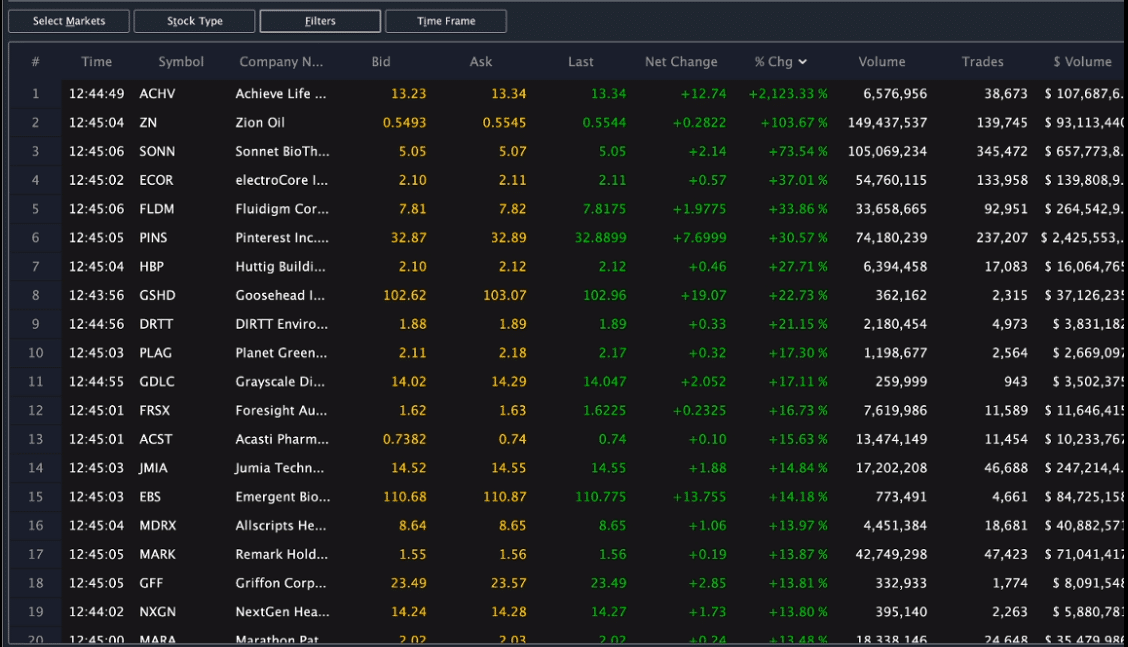
Step 1: I look to my scanner (Scanz.com) as I’ve taught over and over.

I filter by $ volume and then sort by % change.
What I’m looking for is liquid momentum stocks with at least $2M in trading volume.
Why?
It’s an indication the move can be sustainable and the stock can make a move higher.
Step 2: Price action ripped on heavy volume with trade halts due to traders rushing the offers. This happened specifically with KNDI, and it’s been a common theme with momentum stocks recently.
Step 3: Consolidation to the middle $6’s happened. When there’s consolidation after a large move, it typically means the stock is taking a breather before a larger move higher.
Step 4: This consolidation I refer to is intraday Fibonacci or a bull flag, see that blue arrow, that’s the flag portion and where I want to buy, again, I’ve taught this hundreds of times
Step 5: High of day move and a breakout above, triggering the after-hours squeeze to $15, over 100% from where I was trying to buy.
Now, here’s a look at the bull flag setup.

Notice how KNDI made a massive move, and started to trade in range?
That’s a typical bull flag setup. I want to buy within the consolidation area because it allows me to develop a plan.
I would want to stop out if the stock breaks below a key support level, and take profits somewhere after the breakout.
For KNDI, I was targeting the $10 area because it was a key psychological level, and I figured traders would buy into that level and look for the break above it.
I’m upset I didn’t get in my own idea. My job is to alert you before I buy, and the market didn’t want to wait for me to do that. The market doesn’t wait for anyone, it does what it wants to do.
So if you can follow those steps above, you’ll have the same opportunity to see this unfold just like I did and you can then take action when you’re ready and not have to wait for me.
When you feel comfortable doing that, I’ve have done my job teaching you to trade.
If you want to learn my techniques to hunt down momentum stocks before they move…
Then check out my eBook, Momentum Hunter.
You’ll learn my number 1 edge in the market, and how I’m able to spot some of the hottest stocks in the market ahead of time.

I like your advice