Stocks look weak this morning after China released its GDP outlook which came in lower than the expected.
However, these days, I’m stock specific. I’ll let the talking heads on TV figure out where the market goes. Instead, I’d rather focus on keeping things simple.
What does that mean?
For me, it means focusing on my A+ setups. I primarily trade three chart patterns. Each trade I take has a catalyst, and each entry I make has a favorable risk/reward setup.
Believe it or not, you don’t need much more.
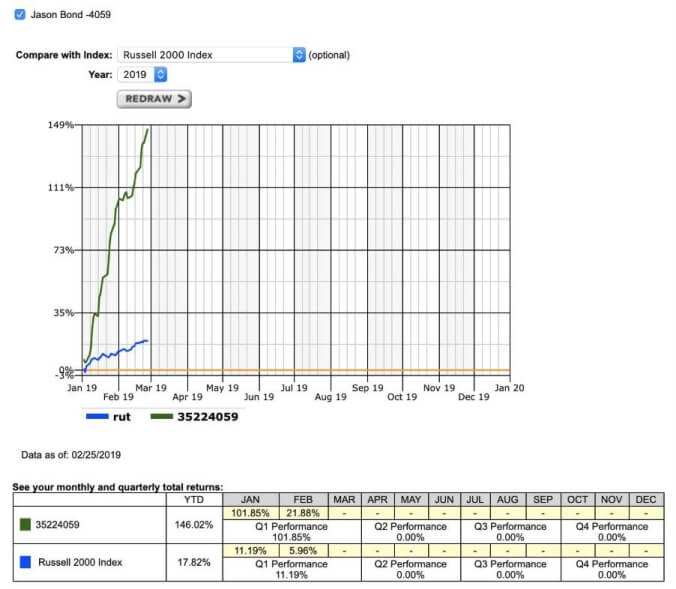
A little more than two months in and I’m up over $300K in trading profits. If you’d like to get my best ideas sent to your inbox or alerted via text, here’s your chance to take me up on my 90-day challenge.
The life you deserve is one trading strategy away.
That said, I want to teach you one of my best trade setups today. It’s a “bread and butter” setup that I call the continuation pattern.
Why should you learn this pattern?
Because it works in today’s market.
Master the mechanics of it… and you too will have a winning set-up in your arsenal.
Chart Patterns Explained – Continuation Pattern
You’ve probably heard me mention “continuation” when I’m scanning for penny stocks using Finviz before. Now, I’ve been getting some questions about this and what it actually means… so let’s get specific.
Basically, in technical analysis, continuation is a pattern that suggests a stock trend is resting after it’s had a strong run-up… and would eventually continue its existing trend.
Now, there are various types of continuation patterns, such as the ascending triangle.
Ascending Triangle Pattern
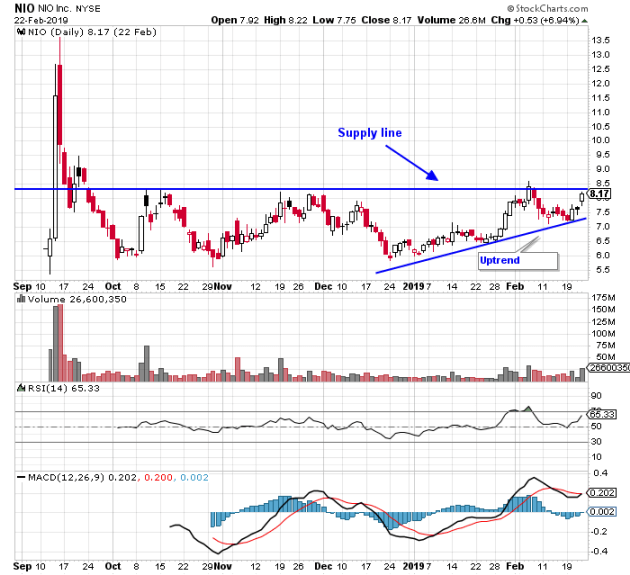
For example, check out the chart on NIO Inc. (NIO) below. This is a clear ascending triangle pattern.
Notice the blue horizontal line, this is known as resistance – or the supply line. The stock has had a tough time breaking above this area. However, if you look at the uptrend line, the stock has been running higher… looking to break above the blue horizontal line.
In general, you’ll see stocks flirt with the resistance area before breaking above it.
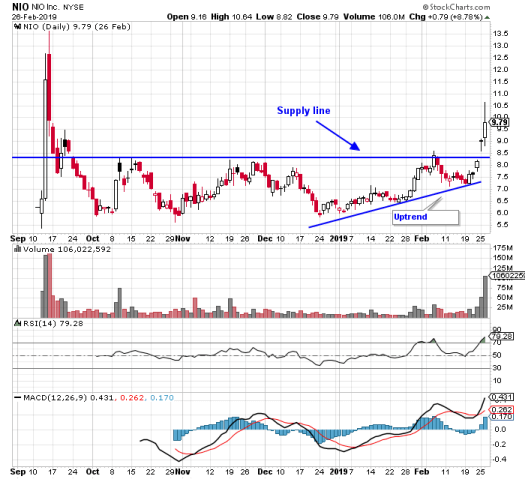
However, there are sometimes when the stock gaps above the blue horizontal line based on a positive catalyst. That’s exactly what NIO did. Now, the gap up was due to a market-wide catalyst: the U.S. – China trade talks. You see, NIO is a Chinese stock, and when there were positive comments about the trade talks… well, it did this:
Moving on. There’s the bull flag continuation pattern.
Bull Flag Continuation Pattern
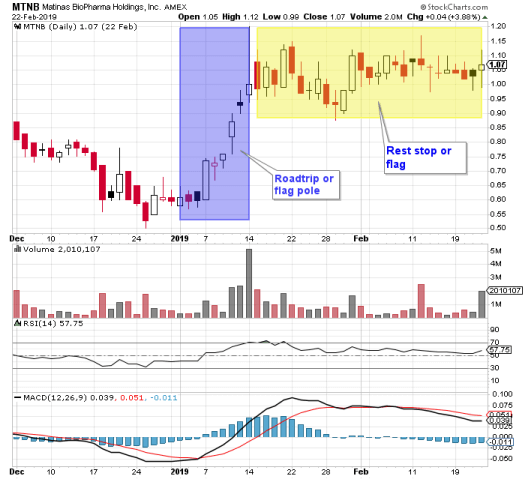
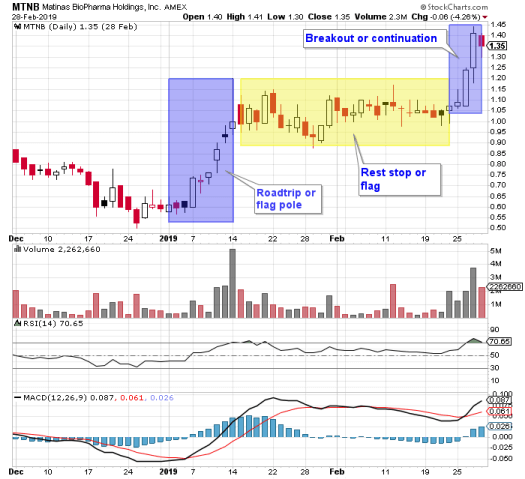
Now, with the bull flag continuation pattern, the stock has a strong run higher – usually within a few trading days – and takes a rest stop. You see, when stocks explode higher… they need to take a rest. Think if you’re going on a long road trip… you’re going to have rest stops in between… until you continue on the road trip to reach your destination.
Here’s what I’m talking about:
If you look at the daily chart of Matinas BioPharma Holdings (MTNB) above, you’ll see some annotations. Well, the blue rectangular area is known as the road trip or “flag pole”. Thereafter, the stock takes a rest and forms the “flag” part of the bull flag.
What does the stock do after though?
Well, it tends to break out…
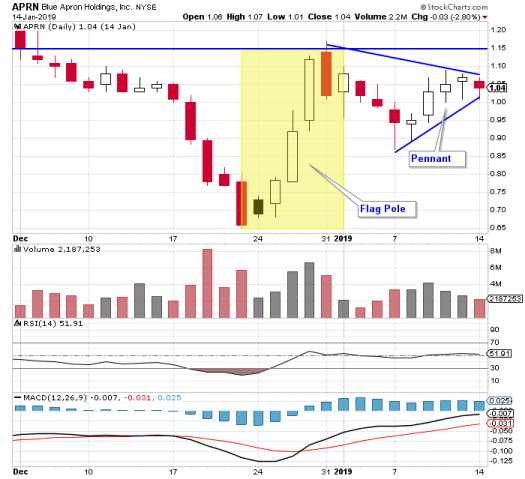
Since we’re talking about the bull flag continuation pattern… it’s worth mentioning the bull pennant continuation pattern. It’s very similar to the bull flag…
Notice the yellow rectangular area, this is the flag pole – pretty much identical to the flag pole in the bull flag pattern. However, you’ll notice two blue lines that look like they’re converging and forming a symmetrical triangle. Well, this is the pennant part of the pattern.
Well, what do you do when you see this pattern?
Generally, if I see this pattern, I’m also looking at potentially positive catalysts and playing for the stock to continue higher.
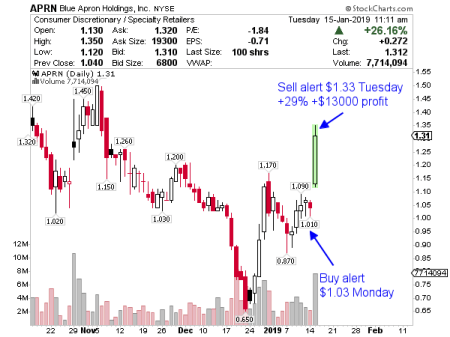
Now, I actually traded this stock – Blue Apron Holdings (APRN):
Did I know the stock was going to gap up and run higher like this?
No.
I just focus on my patterns, spot potential catalysts, develop a trading plan, and buy when I find an area of value. With this specific pattern, I bought at $1.03 because the stock had some value in that area.
The patterns get me into a stock… and the catalysts drive them higher.
The catalyst here was a company announcement. Blue Apron noted it could achieve profitability on its EBITDA basis for the 2019 fiscal year – don’t worry if you don’t know what this means… we’re just focused on the pattern here. In addition to this news, the company announced it could potentially partner with Weight Watchers (WTW) – that would further drive its potential growth.
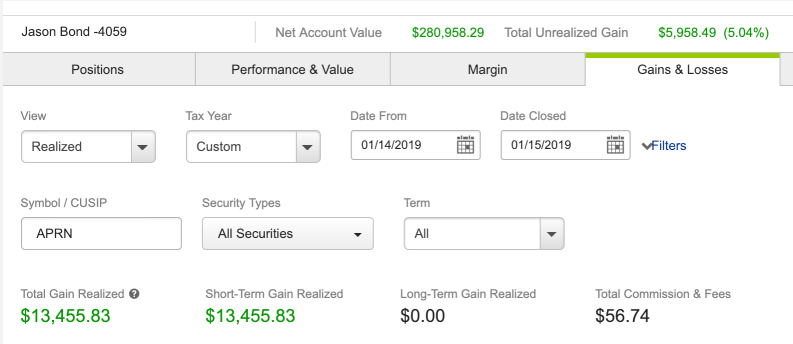
Just by using that pattern, I was able to lock in $13,455.83 in just one day.
There are over thousands of stocks that you can trade. Trying to make sense of the market can be overwhelming. However, you can get ahead if you simply narrow your focus. Believe it or not, more is less when it comes to trading.
I’ve been able to achieve massive success this year by sticking to three basic setups, one of them, the continuation pattern, which you’ve learned about today. Now, if you want to follow my trades in real-time, take me up on my 90-day challenge, and get started today.
The diary of a real $ trader,

Jason Bond
JasonBondPicks.com

0 Comments