Small-cap stocks are running hot… but IWM (the Russell 2000 ETF) looks has hit a brick wall, as it presses up against some key resistance levels.
However, it’s likely the $160 level acts as a key support level into the year-end… especially if we get some more positive news regarding the trade deal.
Overall, I’m still optimistic the trend will continue… but I’m also not ignoring the fact that there will be short sellers looking to pile in here.
You see, small-caps haven’t reached overbought levels yet so this trend can certainly stretch further— trap the shorts and squeeze higher.
Heck, even if IWM pulls back, there will be so many opportunities to take advantage of based off the simple patterns I trade.
For example, when IWM is near highs, I’m looking for momentum buys… like FuelCell Energy (FCEL).
The other day, I spotted a hidden level in FCEL… and locked in a 23% banger!
How did I spot the perfect entry, and more importantly, how can you use this simple setup to your advantage?
Simple Chart Setup Uncovers A 23% in FCEL
The other day, FCEL announced a massive catalyst. The company announced it would expand a deal worth up to $60M with XOM.
For a micro-cap company, a $60M deal is pretty sizable.
At the time, I looked at the chart setup… and it looked pretty ugly. However, with this news, I figured it could fuel a run up all the way to $1.
When I pulled up the stock, I saw it up 50% that morning… and typically, when traders see a stock like that, they think they missed out.
However, that’s not the case with small-cap momentum stocks. I looked for signs of strength inside that day to position myself for a strong close by the end of the day. In other words, I was looking for an area of value to buy FCEL.
With a new CEO, this deal with XOM could be the turning point for the troubled green energy company. My plan was to trade smaller than usual, given how risky the stock is, and I looked for 20%+ same day or overnight on a gap.
The Play
If you know anything about trading momentum stocks… chart patterns work really well. When a stock has a massive gap up like FCEL did… there’s one simple charting tool I love to use — the Fibonacci Retracement pattern.
How does it work?
It’s really easy, all you have to do is identify a high and a low, and nearly every charting software will do the work for you.
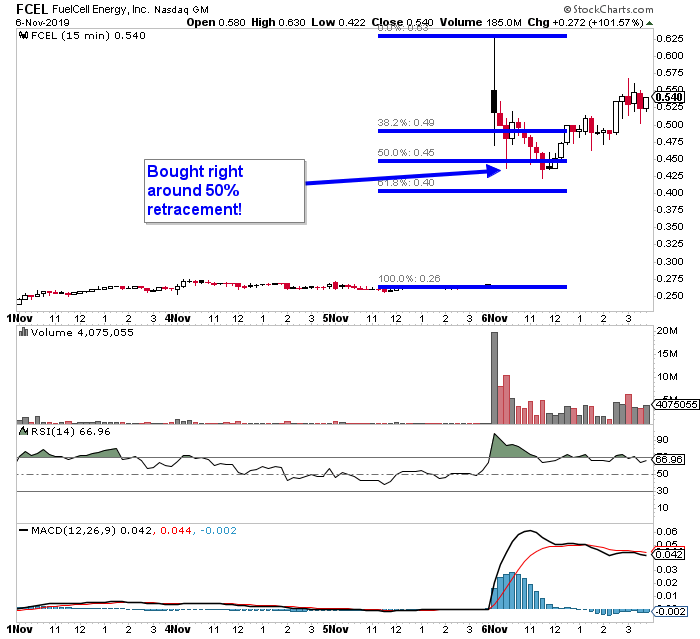
Check out the 15-minute chart in FCEL below.
All I did was use the tool to connect the low (where it gapped up from) to the high that day.
That allowed me to find a key Fibonacci retracement level. If you look at the chart above, the 50% retracement level was right around $0.45. This lets me know it’s an area of value and there’s some support around there.
Generally, when we see stocks gap up like FCEL did and pull back to a key level, they run higher and attempt to break its high of the day.
The Fibonacci retracement pattern is so powerful because it allows you to plan your trades ahead of time
If you bought around $0.46, worse case you would stop out if it broke below the 61.8% ($0.40), which is another key support level.
Once I saw the stock reach that level… I knew it was time to get in.
So what did I do?
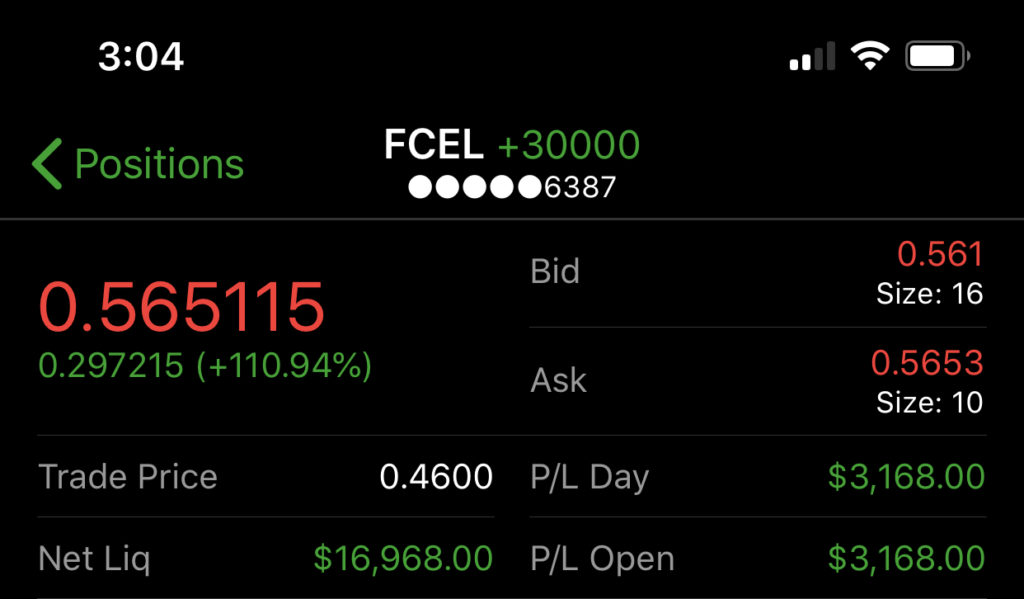
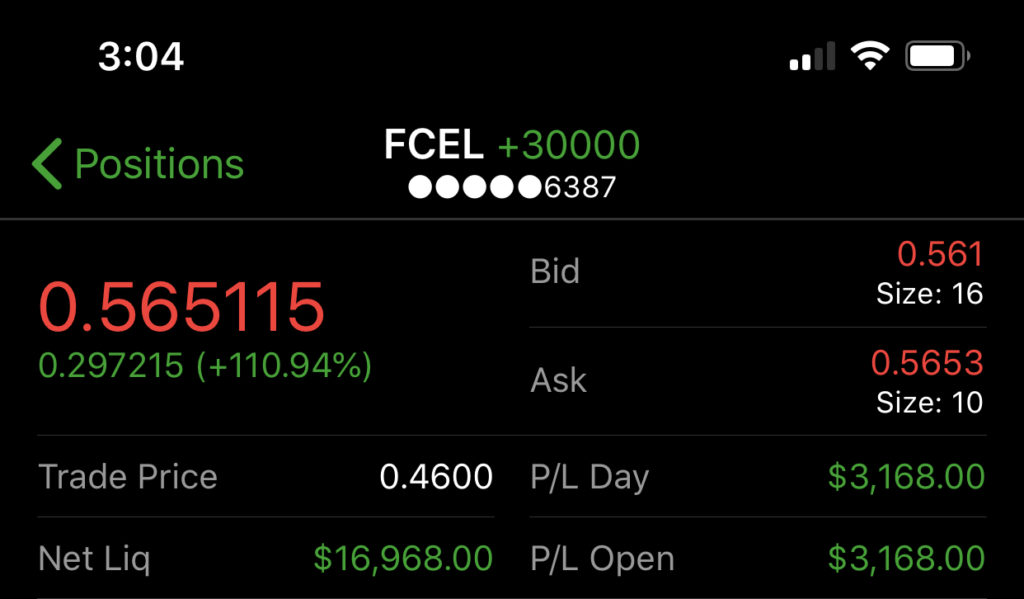
I bought shares at $0.46 (just above the 50% Fib retracement level), looking for a run higher… and boy did it work out.
I entered the trade around 10:00 AM… and just a few hours later, I locked in a whopping 23% return!
The thing is, we see plays like this ALL the time in small-cap momentum stocks. The best part is you really only need to know two simple patterns to spot EXPLOSIVE opportunities all the time. All you have to do is take the next step, and join now to set yourself up for success.


0 Comments