As U.S. weekly jobless claims jumped by 6.6M last week, one would expect the market to tank… right? Well, that wasn’t the only news this morning, the Fed provided more details on how it will support the economy in these trying times.
This market environment is so wild, and I wanted to give back to the trading community.
I decided to open up a discussion with my readers, and take questions. My inbox was flooded with responses, but there was one question I kept noticing: Can you explain your trading process?
Of course, I want to provide you with the best experience possible — so I want to reveal my trading process and show you exactly what I do to hunt down momentum stocks.
[Revealed] My Trading Process To Uncover Stocks Poised To Breakout
When it comes to finding stocks to trade, I do look at the overall market (depending on what I’m trading). So I’ll check out the Russell 2000 ETF (IWM), SPDR S&P 500 ETF (SPY), and PowerShares QQQ Trust (QQQ).
What I mean by that is if I’m trading small-cap momentum stocks, I’ll look to see how IWM is performing. Since I look for swing trades and want to time my entries and exits, I don’t want to fight the overall market direction… especially in this environment.
For me, it’s pretty simple because all I do is look at the overall chart of an ETF and compare them to some of the stocks I have on my watchlist. Unless I see my pattern come up and have a plan in mind, I won’t place a trade.
Now that you have an understanding of my style and what I do, I want to show you how I filter for momentum stocks to trade.
How I Locate Stocks to Potentially Run Higher
You probably already know there are thousands of stocks to potentially trade out there, and I don’t know anyone who could trade thousands of stocks, let alone hundreds. So in order to drill down and find the best opportunities for myself, I use a scanner.

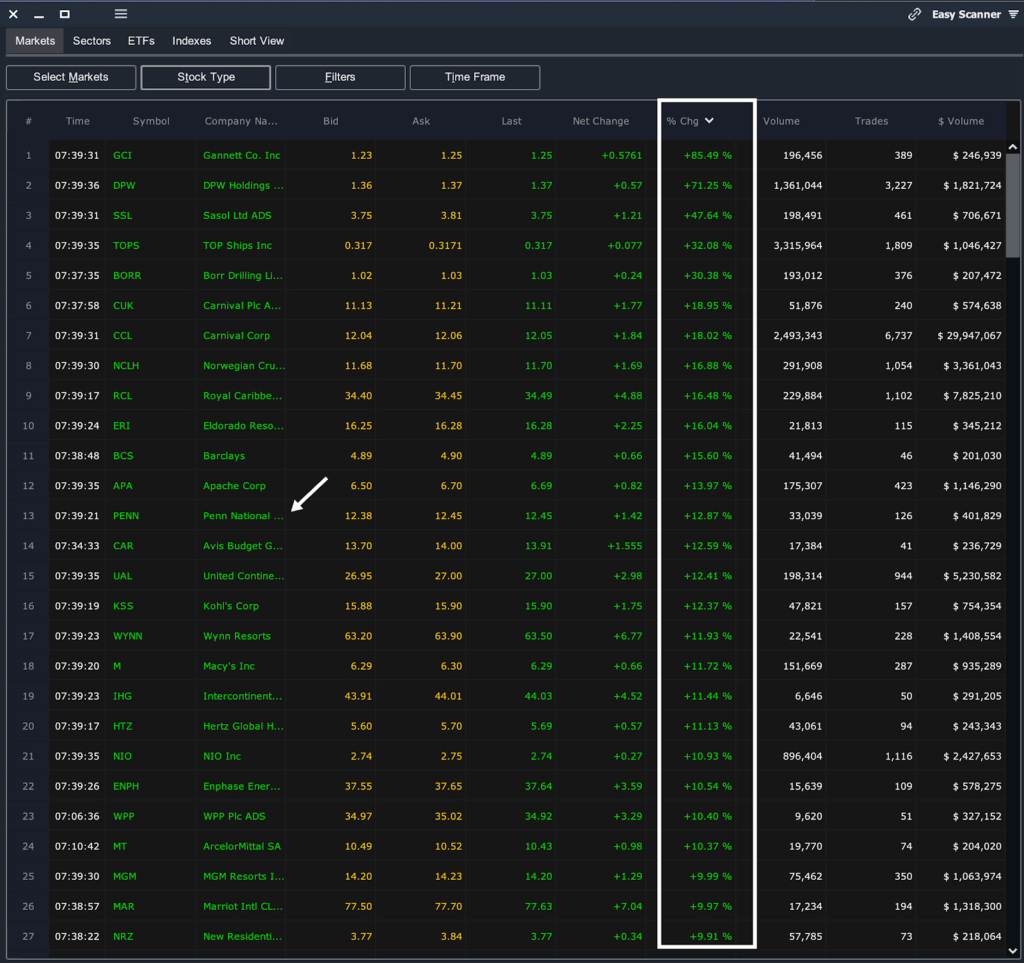
Source: © Scanz Technologies Inc.
The beauty of having a scanner is that it allows me to simply find the top stocks to trade on any given day. Typically, I’ll get up bright and early to scan for some of the fastest moving stocks. Thereafter, I’ll check up on the news and the chart pattern.
For the scanner, I’ll try to look for stocks under $30. The main factor I look for (in the pre-market) is at least $200K in dollar volume. In other words, the stock price multiplied by the number of shares traded for the day should amount to more than $200,000 before 9:30 AM ET.
As the opening bell approaches, I change the filter and look for stocks that have at least $2M in $-volume in liquidity. Thereafter, I just rank the stocks by the percentage change.
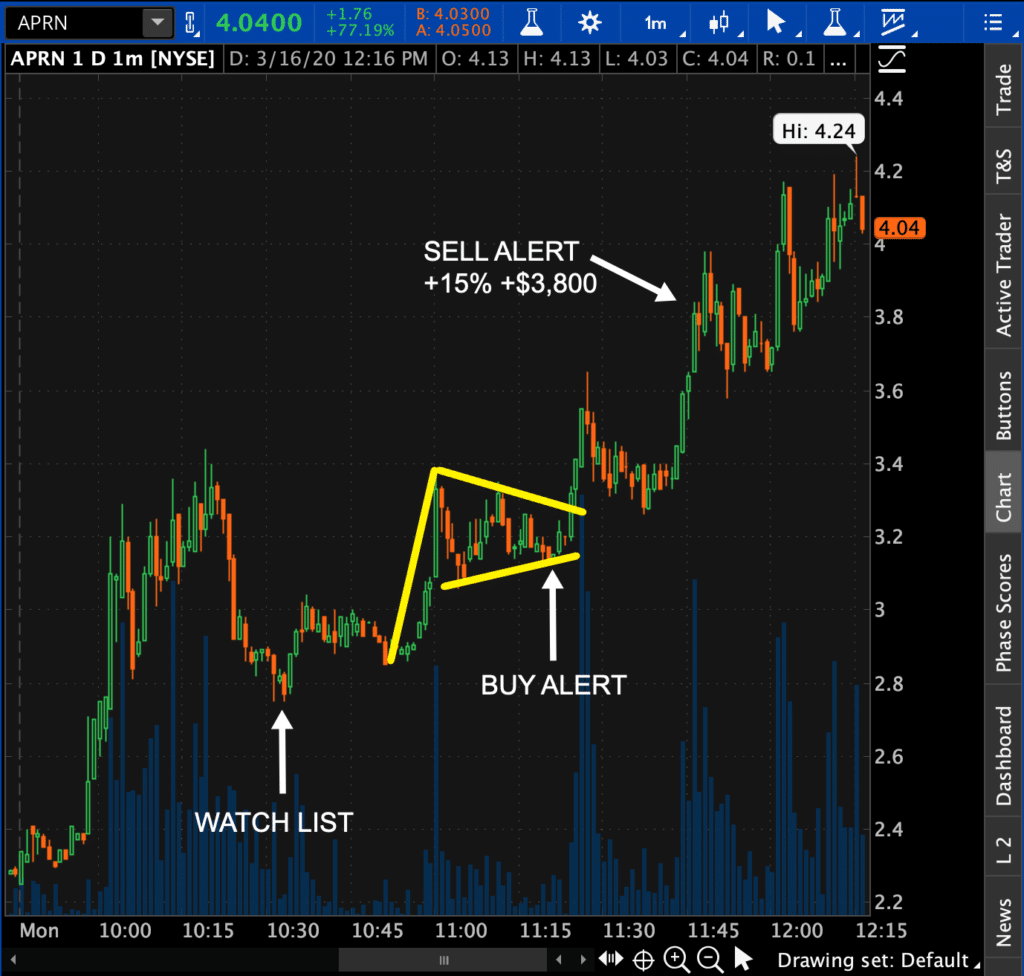
Once I find stocks to potentially trade, I look for my key patterns. If I’m looking for potential breakout plays, I’ll look to the bull flag/pennant pattern. If you don’t know anything about the pattern, I made a lesson on the key factors to look out for with this pattern.
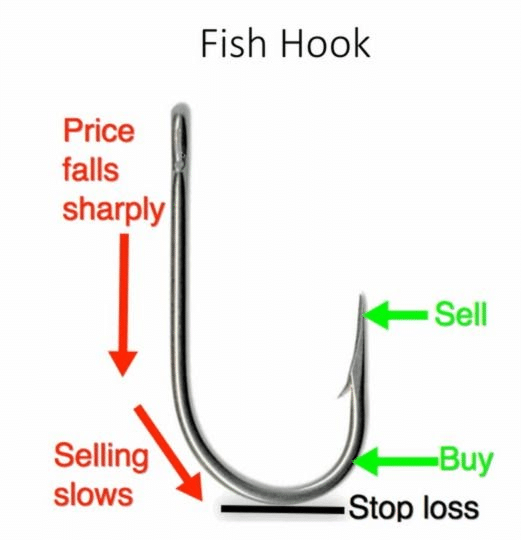
On the other hand, if I want to play the bounce in oversold stocks… I’ll look to use my fish hook pattern.

That’s really about it for my trading process. I look at the overall market direction, filter for stocks to potentially trade, conduct my due diligence and look for my key patterns. Thereafter, I develop a trading plan and execute it.
Now, if you want more details on how to hunt down momentum stocks that could potentially breakout… I’ve compiled my years of trading experience into my brand new eBook, Momentum Hunter.
If you want an in-depth look at how I use my key patterns to spot momentum stocks for me to trade, then click here to receive your complimentary copy now.


Looking forward to receiving my copy.
Excellent as a newibe its all about gaining g confidence which comes with experience and in this case your experience thank you keep it coming rinse and repeat
Hi Jason,
Although I’m very conservative and usually quite skeptical about offers like yours that seem to be too good to be true, I signed up for JBP on March 25, 2020. I’ve never really done any serious trading. About 20 years ago I acted on a tip or two from friends and the results were dismal.
I’ve been keeping track of the results I’ve had following your prompts. Most of my trades have been on paper (training wheel feature of thinkorswim), but for a few, I used real money ( I only had $200.86 available to trade with). I’ve been with you now for 15 days. In the trades I’ve closed, I’m up $6299.44 (6.3%) overall and up $28.32 (+14%) in real money. I did lose a little on several PENN trades, but I didn’t quite have my feet under me and probably still don’t, but it was on paper, and I’m still up as already mentioned. I can send you a copy of the spreadsheet I’m using to track my results if you like (the good book says “do not despise small beginnings,” so don’t laugh).
I’ve also called and talked to several of your support personnel (Kevin and two others). I was treated like they genuinely cared. You guys just might just be for real.
Best Regards,
Mark