Tomorrow is the start of a new trading week, and I’m sure there will be traders chasing stocks left and right… and trying to buy the dip in some names.
What I’ve noticed in this environment is the new breed of retail traders aren’t afraid to take on risk.
Being able to stomach risk and chasing stocks because you’re afraid of missing out are two very different things.
It’s no wonder why so many traders have been asking…
How Do You Find Hot Momentum Stocks?
I think people are starting to realize that if and when volatility picks up, the strategies they’re using right now may not be viable.
After all, the market has been on an absolute tear.
I want to show you my techniques to uncover hot momentum stocks in nearly any market environment… and not necessarily have to chase action.
One Key To Understand Momentum Stocks
To me, there’s one thing that rules when it comes to momentum stocks…
Price action.
It matters now more than ever because the overall market just doesn’t make sense, and if you look at the fundamentals or headlines, you’ll realize what I’m talking about.
I mean I don’t know about you, but when I look at all the news, things get pretty jumbled and you never really know what piece of information will move stocks.
I believe understanding price action and charts are a heck of a lot easier than trying to dissect news.
Why?
Well, think about it like this…
Charts let us know the trades that went off and where the supply and demand lie.
In other words, they can be helpful to identify where to enter a stock may head, as well as identify where to enter and exit.
Let me show you what I mean by that.

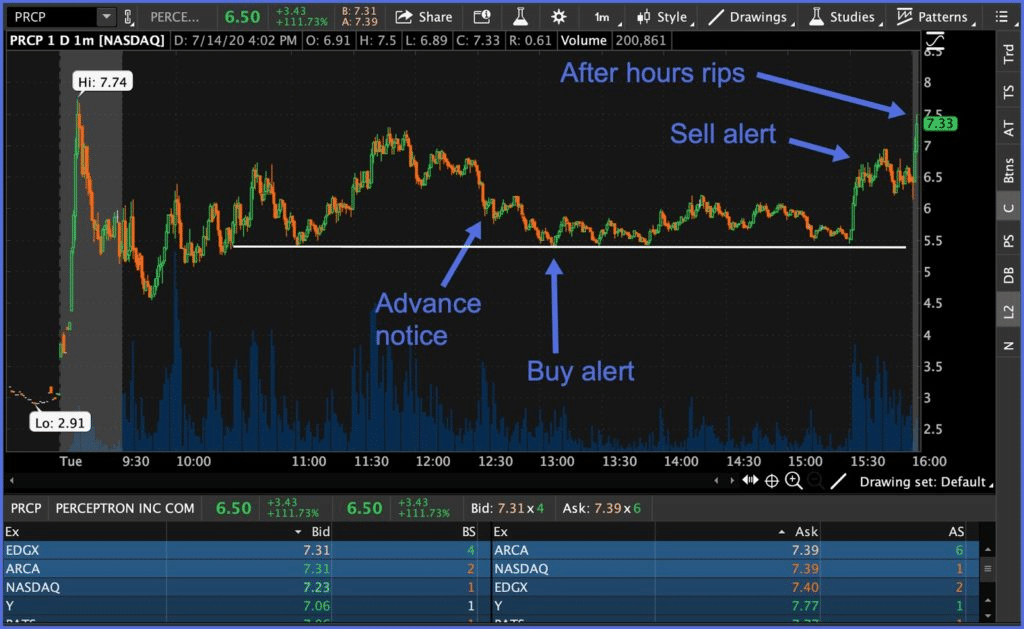
Check out the chart in PRCP above.
Notice that white horizontal line?
That served as a support level. In other words, there was demand near that level.
That signals there may be buyers and the stock could pop from that level.
As you can see, it’s a stock I actually traded.
By uncovering this pattern and the support level, I was able to develop a plan.
Here’s what I sent out to subscribers…
Initially I’m watching $6.50’s, but thinking $6 or $5.50 might get tested later today. What I think is likely to happen is it comes into the $6 or $5.50 level before 2 p.m. ET and then it consolidates.
If it holds that area that’ll be the indication for me to take a shot looking for it to run toward the high of day (hod) into the close or $7.20’s. If all of that happens then I’ll lock 1/2 or all my profit from that middle $5’s entry out in the upper $6’s with the option to hold part of my position for a gap tonight or tomorrow morning.
Here was the plan…
Buy zone: $5.50 – $6
Goal: low $7’s today, possible gap trade
Stop loss: aggressive at $4.50’s, otherwise tighter to entry based on my size and risk appetite.
As you can see, the stock never triggered my stop loss…
I actually didn’t size the trade as large as I wanted to…
I bought 3,000 shares at $5.43, slightly below my buy zone…
And the stock actually made a move, and I got out at $6.56 because I didn’t want to hold this position overnight, as I had other positions on.
However, as you can see, the stock actually got to the low $7 area (the target).
Now, I believe following price action is highly important when it comes to uncovering momentum stocks poised to move.
However, there are so many technical indicators and chart patterns… it can get confusing.
That’s why I put together this special training workshop to reveal to you the chart patterns I’ve found to be useful to identify momentum stocks… poised to run.
See how chart patterns can help traders spot momentum stocks before they run.

0 Comments