With so much action in the market at these levels… it often gets difficult to keep up for many traders.
There’s one question that many readers have on their minds now — “How do you develop a watchlist?”
Today I want to draw back the curtains and reveal how I’m able to develop a watchlist and hunt down some of the hottest momentum stocks out there.
I’m actually glad that this question popped up because it tells me traders are engaged and want to plan ahead.
Let’s cut to the chase… here’s an in-depth look at how I come up with my watchlist and what stocks are on my radar right now.
My Techniques To Develop My Momentum Stocks Watchlist
For the most part, my process to create a momentum stocks watchlist starts with a scan.
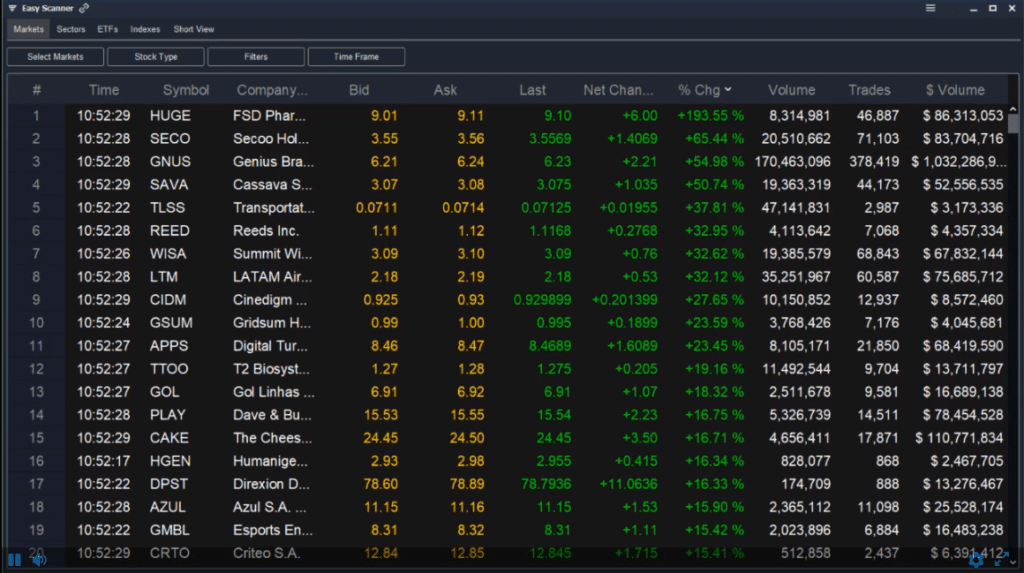
Source: Scanz Technologies
I monitor this a few times throughout the day (mainly in the pre-market, about 30 minutes to an hour after the opening bell, and in the early afternoon).
By looking at my scanner, I’m able to filter for stocks that I want to trade. For the most part, I’m looking for stocks that are liquid and running higher. However, I’ll also look for stocks that are pulling back as well.
Once I’ve found stocks on my scanner, I look at the news and the charts.
That’s how I came up with my momentum stocks watchlist for today.
For example, Hexindai Inc (HX) is one stock on my watchlist.
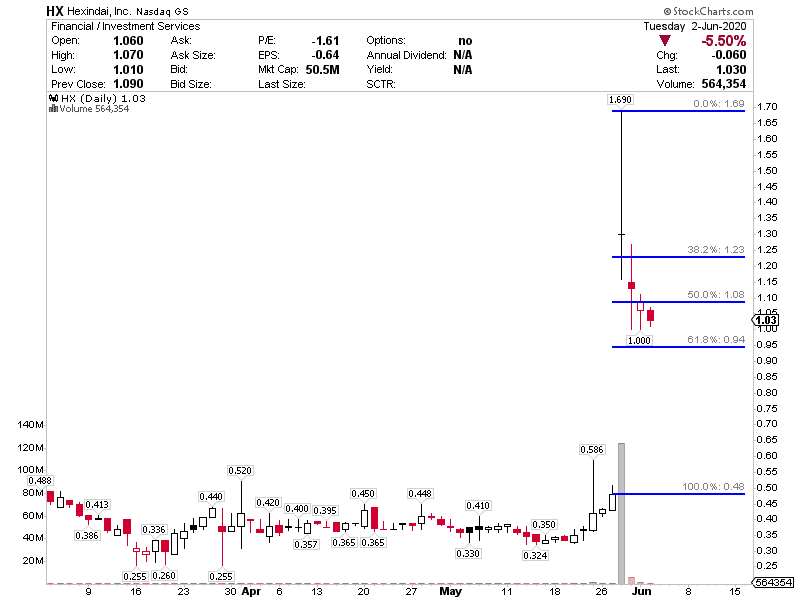
Chart Courtesy Of StockCharts
If you look at the chart above, it’s the Fibonacci retracement pattern. The reason HX is on my watchlist is because there are areas of value and upside potential. I can clearly identify my entry, target, and stop-loss.
For example, it’s actually the same pattern I used for Nano Dimension (NNDM), which was on my Monday Movers watchlist last week.
Here’s the note I sent out to my subscribers in my advance notice alert this morning…
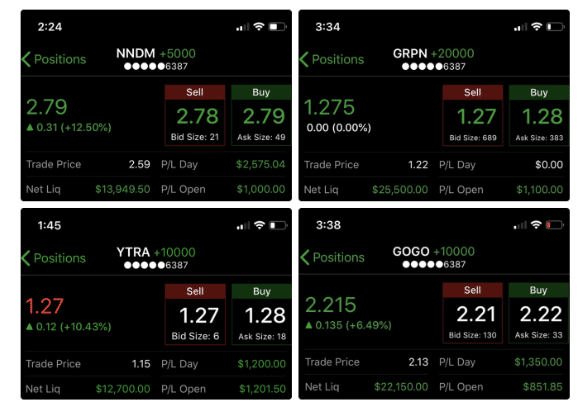
It’s not a mistake that I made money on NNDM Tuesday, having bought on Friday after issuing my Monday Movers advance notice. No, my NNDM position didn’t go up Monday, but the pattern was still good so I held and Tuesday it ripped and I sold for a nice gain. Learn this pattern, it’s one of the best I know for trading momentum pockets. Do not confuse NNDM being on this list as advance notice on it, I’m using it to teach you the pattern. See how it ripped Tuesday after the rest period? That’s fibonacci. Good news causes the initial rip. Then the company raises money and it tanks. Then it rests. Then it often pops. So by looking at how I traded NNDM Friday into Tuesday and comparing it to the HX chart above, you can see more clearly what I see.
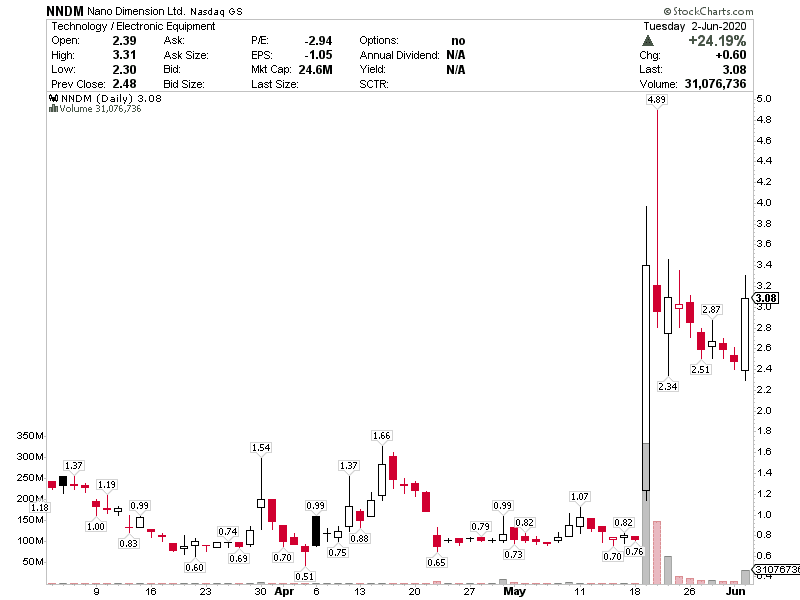
Chart Courtesy Of StockCharts
So HX is one stock on my radar right now.
Another stock on my radar is cbdMD Inc (YCD). It’s the same pattern I saw in NNDM and HX.
Here’s what I sent out to subscribers this morning…
YCBD same thing. Earnings winner. Rest phase. Rising trendline. In play above $1.45 for me so that’s the stop loss. Goal upper $1’s for profit.
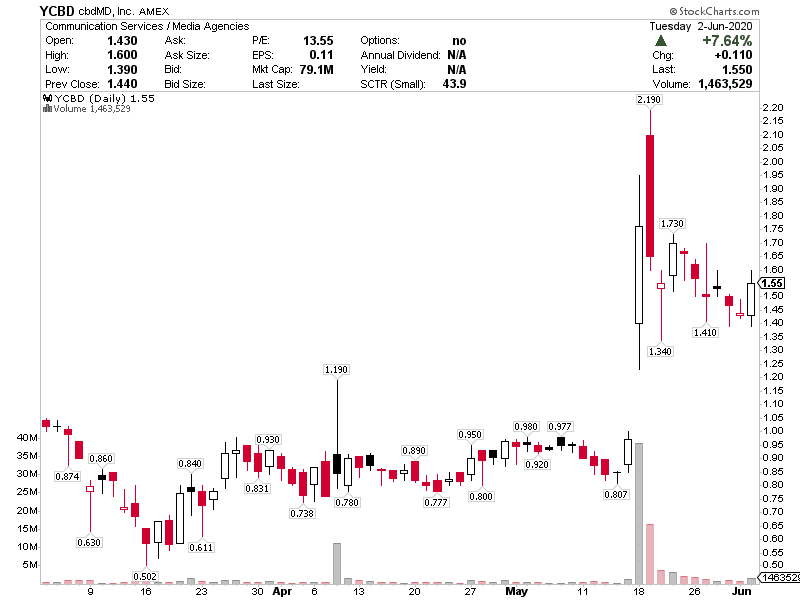
Chart Courtesy Of StockCharts
Now, if you want to learn more about my trading strategy… and how I’m able to locate momentum stocks poised to make large moves, then click here to watch this exclusive training session.
If you register now, you’ll receive a $300 value… absolutely free.
DISCLAIMER: To more fully understand any Ragingbull.com, LLC (“RagingBull”) subscription, website, application or other service (“Services”), please review our full disclaimer located at https://ragingbull.com/disclaimer
WE MAY HOLD SECURITIES DISCUSSED. RagingBull has not been paid directly or indirectly by the issuer of any security mentioned in the Services. However, Ragingbull.com, LLC, its owners, and its employees may purchase, sell, or hold long or short positions in securities of the companies mentioned in this communication.

0 Comments